
This Comprehensive Land Use Plan (CLUP) 2019-2029 of Sorsogon City is an enhancement
and update of the existing CLUP. The data preparation initially started during the conduct of the
city vulnerability assessment in 2008 when the city was a recipient of the technical assistance
conducted for the Cities in Climate Change Programme of the UN Habitat. During the course of
preparation, data from NSO (now PSA) were updated as they were released. Rapid Community
Based Monitoring System (RCBMS) data were also used for geotagging and ground truthing
locations of households.
As a result of the vulnerability assessment, it was recommended to revisit the city’s
development plans to see if the identified future programs and projects are resistant to the
impacts of climate change and addresses disaster risk reduction objectives. The Climate Change
Act was passed in 2009 and the Disaster Risk Reduction and Management Act in 2010, requiring
the mainstreaming of climate change adaptation and disaster risk reduction in all local
development plans.
This Comprehensive Land Use Plan (CLUP) determines the specific uses of land and
other physical and natural resources, both private and public, within the territorial
jurisdiction including areas for critical watersheds, river basins, and protected areas. The
Sorsogon City CLUP also tried to delineate actual boundaries on the ground, embody the
desired land use patterns of the barangays and the municipality as a whole. The spatial
directions prescribed in this CLUP shall serve as the basis for the preparation and
formulation of the Comprehensive Development Plan (CDP) and Local Development
Investment Programs (LDIP) of the LGU in the future.
In the preparation of this CLUP, the Core Planning Group consciously complied
with the following legal promulgations, to wit;
Republic Act 7160 (Local Government Code of 1991)
The Republic Act 7160 (RA 7160) or the Local Government Code of 1991 provides
the mandate of LGUs on local planning, legislation, implementation, including budgeting,
and monitoring.
Section 16:
“Every LGU shall exercise the powers expressly granted, those necessarily implied there
from, as well as powers necessary, appropriate or incidental for its efficient and effective
governance, and those which are essential for the promotion of the general welfare.
Within their respective territorial jurisdictions, local government units shall ensure and
support, among other things, the preservation and enrichment of culture, promote health
and safety, enhance the right of the people to a balanced ecology, encourage and support the development of appropriate and self-reliant scientific and technological capabilities,
improve public morals, enhance economic prosperity and social justice, promote full
employment among their residents, maintain peace and order and preserve the comfort
and convenience of their inhabitants. ”CLUP Guidebook 2013 Volume 1”
Section 20(c):
“The local government units shall, in conformity with existing law, continue to prepare
their respective Comprehensive Land Use Plans enacted through zoning ordinances which
shall be the primary and dominant bases for the future use of the land resources
Section 447(2)(vii)/Sec. 458(2)(vii):
“Adopt a Comprehensive Land Use Plan for the municipality/city: Provided that the
formulation, adoption, or modification of said plan shall be in coordination with the approved
Provincial Comprehensive Land Use Plan.”
Section 447(2)(ix) – Municipality/Section 458(2)(ix):
“Enact integrated zoning ordinances in consonance with the approved Comprehensive
Land Use Plan, subject to existing laws, rules and regulations…”
Section 447(a)(2)(vi)/Sec. 458(a)(2)(vi):
Prescribe reasonable limits and restraints on the use of property within the jurisdiction of
the municipality (Sec. 447(a)(2)(vi)/city (Sec. 458(a)(2)(vi).
Section 444(b)(3)(vii)/Sec. 455 (b)(3)(vii):
“Adopt measures to safeguard and conserve land, mineral, marine, forest, and other
resources of the municipality” (Sec. 444(b)(3)(vii)/city (Sec. 455(b)(3)(vii).
Section 468, 2, Article III, Chapter 3, Book III:
“(vii) Review the Comprehensive Land Use Plans and zoning ordinances of component
cities and municipalities and adopt a Comprehensive Provincial Land Use plan, subject to
existing laws.”
Other related legal bases on CLUP formulation provided for under RA 7160 are found
under sections 106(a); 109, a, 1-2 and 458(2)(ix); 476(7).
Executive Order No. 72
Executive Order 72 was issued providing for the preparation and implementation of the
CLUP by the local government units and for the review and approval thereof by the HLURB
and the Sangguniang Panlalawigan.
Sections 1(a, d):
“(a) Cities and municipalities shall continue to prepare or update their Comprehensive
Land Use Plans, in conformity with the land use planning standards and guidelines
prescribed by the HLURB and to national policies.
“(d) … the powers of the HLURB to review and approve the Comprehensive Land Use
Plans of component cities and municipalities are hereby devolved to the province”.
Significant Insights
• Explain purpose, context and limitations of the proposed CLUP
• Legal and enabling ordinance or guidelines adopted or complied with in the preparation
of the proposed CLUP
• Significant(new) insights and areas adopted or included in the new CLUP compared to
previous/existing CLUP (i.e. inclusion of climate change/disaster risk/threats; adoption of
integrated eco-systems approach (i.e. ridge-to-reef); Citizen Report Card, and other
significant changes not seen from previous/existing CLUP)
The enhancement of the Comprehensive Land Use Plan of Sorsogon City considered
disaster risk reduction and the impacts of climate change. The review triggered after the findings
of the vulnerability and adaptation assessment was conducted.
With the new guidelines in the formulation of the Comprehensive Land Use Plan, the
team decided to include Forest Land Use and other new tools stated in the Housing and Land Use
Regulatory Board guidelines.
The Comprehensive Land Use Plan is centered on the spatial dimension regarded within
a time horizon, usually ten years. It translates into land allocation space requirements of the
different sectors deemed vital by local conditions and aspirations. Allocation of land uses is
reviewed every five years allowing the city to make corrections and enhancements, and measure
its progress against the plan.
The methodology used in preparing this Plan is to gather technical data from agencies,
both local and national, that usually maintain them. These data served as quantitative input.
Where secondary data were insufficient, actual surveys were made. Surveys include foot,
windshield, and interviews with key technical people. By and large it was based on the land use
planning guidelines issued by the Housing and Land Use Regulatory Board including the 2013 and
2014 versions.
These data were processed and turned into the sectoral studies where data were range
against planning standards to identify development needs.
To supplement the needs analysis, the strategic plan of Sorsogon prepared earlier was
reviewed to confirm quantitative needs and fill-in qualitative ones. The strategic plan also
contained the vision and mission of Sorsogon, its strengths and weaknesses, and development
goals, objectives, and strategies.
Maps, as another view of existing situation, were prepared. Thematic maps were
prepared which were later layered to outline the limits of possible land uses. One of the outputs
from the vulnerability assessment resulted in the Policy Zone Map which delineates the four zones
based on the risks and policies for development strategy for each zone. Output maps are the
Proposed General Land Use Plan and the Proposed Urban Zoning Map.
In formulating the Plan, the Provincial Physical Framework Plan was made as reference to
assure that the Plan is not only in conformity but that it further exploits opportunities explicitly
stated in the framework plan. In the same way, the Regional Development Plan, Philippine
Development Plan, Vision 2040, and Sustainable Development Goals were considered in the
formulation of the plan.
This document contains the Sectoral Reports on Historical Development, Physical
Features, Demography, Social sectors, Economic sectors, Infrastructure sectors, Local
Administration, Forest Land Use, Environmental Management, and Land Use. They present the
existing profile of the city. Projections were ranged against standards to provide summaries of
development needs. Goals, objectives, and strategies were validated against these needs and
were harmonized with the city’s functional role and competitive advantage. Validation was made
though workshops and consultations.
It also contains the Alternative Spatial Development Strategies exploring three possible
courses and weighing each according to several predefined criteria to come up with the preferred
development strategy.
The CLUP Technical Working Group, on behalf of the Task Force on Land Use Planning and the
City Government of Sorsogon, wishes to extend its sincerest thanks to the following who have
immensely contributed to the preparation of the 2017-2027 Comprehensive Land Use Plan of the
City of Sorsogon.
- Heads and personnel of local offices of national government agencies;
- Heads and personnel of the various departments of the city government of Sorsogon;
- Barangay officials;
- Representatives of non-governmental organizations and private institutions;
- Private individuals.
They provided needed data, local knowledge, and insights as bases of the analysis; participated in
the cross-sectoral formulation of goals, objectives, and strategies; and facilitated basic data
gathering, land use windshield and foot surveys, and structural survey.
Table 1. Based from the 2010 and 2015 population count, Sorsogon City has a growth rate of
1.54. …………………………………………………………………………………………………………………………… 14
Table 2. Projected Households……………………………………………………………………………………….. 15
Table 3. School going age projected ……………………………………………………………………………….. 16
Table 4. Slope ………………………………………………………………………………………………………………. 20
Table 5. Land cover ………………………………………………………………………………………………………. 21
Table 6. Suitability for Agriculture…………………………………………………………………………………… 22
Table 7. Agri-Fishery Area, Problems and Challenges & Priority Interventions ………………………. 36
Table 8. Agri-Fishery Area & Prospects/ Opportunities ……………………………………………………… 37
Table 9. Tourism Development Program …………………………………………………………………………. 39
Table 10. Connection by Type of Users and Average Consumptin ……………………………………….. 42
Table 11. Sorsogon City Wate Supply Source ……………………………………………………………………. 42
Table 12. Sorsogon City Diversion Projections (2018-2027) ………………………………………………… 45
Table 13. Sorsogon City SWM Monitoring Plan (2018-2027) ………………………………………………. 45
Table 14. Capital Outlay (Physical Development and Structures) …………………………………………. 53
Table 15. Capital Outlay (Equipment and Vehicles) …………………………………………………………… 55
Table 16. Maintenance and Other Operating Expenses ……………………………………………………… 57
Table 17. Maintenance and Other Operating Expenses (cont.) …………………………………………… 59
Table 18. Personnel Expenses ………………………………………………………………………………………… 60
Table 19. Total Projected SWM Cost of Sorsogon City, 2018-2027 ………………………………………. 62
Table 20. SWM Revenue Projections (2018-2027) …………………………………………………………….. 64
Table 21. Annual SWM Cost per Capita (2018-2027) …………………………………………………………. 65
Table 22. Annual Cost per SWM Component (2018-2027) …………………………………………………. 66
Table 23. Comparison of Projected Cost and Revenues ……………………………………………………… 67
Table 24. In summary, shown below are the city diversion targets and quantities within the
period 2018-2027: ……………………………………………………………………………………………………….. 70
Table 25. City Waste Diversion Targets (2018-2027) …………………………………………………………. 70
Table 26. Policy Zone ……………………………………………………………………………………………………. 81
Table 27. Land Classification ………………………………………………………………………………………….. 87
Table 28. Hazard Overlay Zones ……………………………………………………………………………………… 90
Table 29. Proposed Barangay Development Projects ………………………………………………………. 103
Table 30. Proposed CLUP Outcome and Output Indicators ……………………………………………….. 114
Figure 1. Popuation Pyramid …………………………………………………………………………………………….. 13
Figure 2. Location Map …………………………………………………………………………………………………….. 19
Figure 3. Combines Risk to Climate Disaster Map ……………………………………………………………… 25
Figure 4. Climotograpgy of Sorsogon ……………………………………………………………………………….. 26
Figure 5. Temperatre Graph of Sorsogon City ………………………………………………………………….. 26
Figure 6. Existing General Land Use Plan ………………………………………………………………………… 36
Figure 7. Cambulaga, Balete, Guinlajon & San Roque ………………………………………………………… 30
Figure 8. Policy Zone and Development Strategy………………………………………………………………. 31
Figure 9. Road Network ……………………………………………………………………………………………….. 34
Figure 10. Framework …………………………………………………………………………………………………… 43
Figure 11. Diagram of te City SWM Program …………………………………………………………………… 44
Figure 12. Structure of Local Economy…………………………………………………………………………….. 71
Figure 13. Policy Zone Map……………………..……………………………………………………………………………………….80
Figure 14. Structure / Concept Map ………………………………………………………………………………… 83
Figure 15. Concept Zone Map ………………………………………………………………………………………… 84
Figure 16. Proposed General Land Use Plan …………………………………………………………………….. 86
Figure 17. Water Use Map …………………………………………………………………………………………….. 89
Figure 18. Land and Water Use Policies ……………………………………………………………………………………94
Figure 19. Green Areas Along the Road ……………………………………………………………………………………95
Figure 20. Land Water Use Policies ………………………………………………………………………………………….96
Sorsogon City was created by virtue of Republic Act 8806, which was signed into law
on August 16, 2000 and ratified during a plebiscite on December 16, 2000. RA 8806, also
known as the Cityhood Law, called for the merger of the municipalities of Sorsogon and
Baco n into a component city of the province of Sorsogon.
The merged municipalities of Bacon and Sorsogon more or less shared the same
establishment pattern with Bacon leading the way. The present-day settlements grew out
of the Spanish missionary efforts in the 1600s. They both started as missions that were
later made i nto parishes and eventually declared as civilian political units.
Both places were already settled when the Spanish missionaries came in the 1600s.
Pre -historic artifacts found pointing to human habitation ranged from the 3,000-year old
remains in a cave in Bacon and ancient burial sites dug upstream of rivers in Sorsogon.
Bacon was established as a mission in 1609 with Casiguran, the oldest town in
Sorsogon Province and one of the oldest in Luzo n, as the parochial center. It became a parish
in 1617. Sorsogon in turn was a mission of the parish of Bacon. Sorsogo n became an
independent parish in 1628.
Bacon was established as a civilian political unit (pueblo civil) in 1754. Sorsogon, on
the other hand, became a pueblo civil in 1864. Being under the province of Albay (then
composed of what are now the provinces of Albay, Sorsogon and Masbate) trade and travel
was by water transport through the Albay Gulf. Road building between the two towns was
done in the 1840s when the original bridges along the road connecting them were
constructed. At this time both towns had also enjoyed the prosperity brought by the abaca
trade when world supply was dominated by the Philippines. In the 1850s Albay was the richest
province in the country.
On October 17, 1894, the Spanish authorities organized Sorsogon province as an
administrative unit independent from Albay, with the town of Sorsogon as its seat of
government. The new province adopted the name of the town and has since been known as
the Province of Sorsogon. With the secession, Bacon lost Rapu-rapu which became a town of
Albay. By the turn of the century Bacon further lost some of its area when Prieto Diaz was
created as a town from the areas of Bacon and the town of Gubat.
At the start of the American period Sorsogon being the administrative center of the
province became hos t to the Sorsogon School of Arts and Trade (now Sorsogon State
University) and Sorsogon High School (now Sorsogon National High School). Both of these
institutions served Sorsogon and its neighboring towns.
During the first half of the 20th century corresponding infrastructure were constructed
to support the now thriving urban center. The water system and the road network were put up
at this time. The urban center was largely confined within the area defined by the church, public
market, the old municipal hall, capitol compound, and the two high schools. At the very center,
as it is now, were retail stores, shops, and eateries. In between these establishments and at the
periphery were residential houses.
The rest of the built-up areas were barangay (then called barrio) centers. All other land
uses were agriculture and forestry with the former largely monoculture of rice and coconut. These fertile rice and coconut areas and the abundant Sorsogon Bay defined the other role of
Sorsogon as an agricultural and fishery producing area.
The 1960’s saw the introduction of the residential subdivision concept through the
Encarnacion Village, Sts. Peter and Paul Ville Subdivision, and the Housing Project. These
developments virtually redefined the boundaries of the urban center which were further
extended with the establishment of the Our Lady’s Village Subdivisions in Bibincahan and
Pangpang during the 1970’s. By the end of the decade road networks and power supply system
were already in-place to support such extensive development.
Two cargo and passenger ships were by now serving the Sorsogon-Manila route aside
from the services of the Philippine National Railways extended to the province via train
connection buses. But the completion of the Manila South Road portion of the Pan-Philippine
Highway provided a more direct and faster access to Manila-based suppliers and buyers bypassing
regional dealers in Naga City and Legazpi City thereby turning Sorsogon into a subregional
center.
For the rest of the 1980’s and 1990’s subdivision building and the enhanced central
role of Sorsogon fueled the self -feeding character of urbanization and in-migration. The
pressure of urbanization was felt in the conversion of agricultural lands into residential and
commercial uses and forestlands into upland agricultural areas coupled with pollution and
siltation threats to Sorsogon Bay.
Sorsogon continues to evolve into a major growth area and center of activities of the
people of the province. It hosts offic es of government agencies, hospitals, schools, banks,
dealerships, and bus companies. The merger into a city in 2001 made a significant increase
in the internal revenue allotment (national share) as a component city of the province of
Sorsogon. Sorsogon City’s population of 168,110 as counted by the 2015 census has been
continuously growing providing in the process a sizable market base for goods and services
produced by its agriculture, commerce, and industry. Development of Bacon District continued
to expand on the beach front, in barangay centers, and along the main artery which is now a
national road.
At present, Sorsogon is faced with the challenge of balancing its three and often
conflicting roles. Being the administrative, commercial, and educational center of the
province entails a high degree of urbanization. Continuing as an agricultural and fishery
production area requires the conservation of land areas needed by these economic activities.
As an eco-tourism destination, the state of natural and man-made sites is often threatened
by the first two roles.
In addition the climate change impacts and disaster risk resiliency are added challenges in
ensuring sustainable development and protecting environment.
Inter-LGU and Inter-governmental bodies existing
Sorsogon City is a component city of the Province of Sorsogon. With the fourteen
municipalities of the Province of Sorsogon, Sorsogon City participates as member of the
Provincial Development Council. The PDC formulates the long term, medium term, and annual
socio-economic plans and policies, and public investment programs of the province of
Sorsogon. Sorsogon City likewise is a regular member of the Regional Development Council (RDC)
together with the other six Bicol Cities, six provinces of the Bicol Region, different
departments of NEDA Board represented by their regional directors, non-government
organizations in the region, and private sector representatives. The RDC was provided for the
purposes of administrative decentralization to strengthen the autonomy of units therein
and to accelerate the economic and social development of the units in the region.
Other significant local institutional and governance platforms and programs
adopted/innovations
The city is bounded by two large water bodies, Sorsogon Bay and Albay Gulf. For this, the
City Fisheries and Aquatic Resources Council takes part in both activities of the management
councils of Albay Gulf and Sorsogon Bay. The federation of FARMC’s involves adjoining
municipalities and cities fronting the water body.
Sorsogon City is a member of the Sorsogon Bay Management Council. This is composed
of the municipalities and city surrounding the body of water. The Sorsogon Bay Management
Council is an offshoot of the previous 2007 Administrative Order creating the council as a
result of the red tide occurrence in Sorsogon Bay.
To enhance the Health delivery system, Sorsogon City is likewise involved in a zone cluster
of municipalities/city. The Juban, Casiguran, SorsogonCity and Magallanes (JuCaSoM) cluster
covers the city.
Recent recognition and awards obtained from international/national/regional or private award
giving bodies
Sorsogon City is a recipient of the Seal of Good Local Governance (SGLG) for two
consecutive years, administration years 2015-16. The Department of the Interior and Local
Government awards this seal to LGU’s who pass their criteria on good financial housekeeping,
social protection, disaster preparedness, peace and order, business friendliness and
competitiveness, and environmental management. Previously, a Seal of Good Housekeeping
(SGH) was also received from the same agency.
The city is also an awardee in 2015 as climate adaptive and disaster resilient (CLAD) city
from the Climate Change Commission and recognized as a committed city to resiliency and
readiness, by the United Nations Office for Disaster Risk Reduction (UNISDR).
Several regional and provincial awards and recognitions were received by Sorsogon City
recently (2010-present) on child friendliness (Seal of Most Child-Friendly city) , environment
(Gawad Gobernador sa Kapaligiran), tourism (Gayon Bikol Tourism Award), competitiveness
(40th Most competitive City), health (Salud bikolnon Best Achiever), and infrastructure (20th in
Infrastructure) among others.
Population Composition
Based on 2015 Census of Population conducted by the Philippine Statistical Authority,
Sorsogon City has a population count of 168,110. Sorsogon City has highest population in the
province and accounts for 21.20% of the total population of the Province of Sorsogon at 792,949.
Compared to the region, Sorsogon City is only 2.91% of Bicol region’s population. The growth rate
was 1.54% for the period 2010 to 2015. Total households was 35,394 with an average household
size of 4.74 members per household. The projected population was 178,707 and the projected
number of households was 37,702 in the same year.
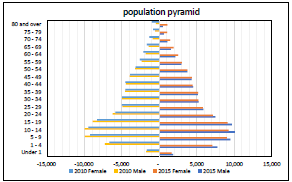
Figure 1. Population Pyramid
The population of Sorsogon City in 2015 is generally young with 54.8% belonging to the
below 15 years old and 44% of the school going age population. The male population is slightly
more than the female population with a sex ratio of 107 male for every 100 females. The total
age dependency ratio is 38% or with 33 young dependents, ages 0-15, and 5 old dependents, ages
65 and over, for every 100 individuals of productive age or ages 15-65. Labor force is 66.35% of
the total population. Of the 110,779-labor force population, only 61,989 is employed based on
2015 Status of Employment data.
Almost half of the population lives in the urban barangays as considered by the city based
on the ordinance. The ratio of urban to rural population is 43 is to 57. There is a slight increase in
terms of percentage of the urban population since Sorsogon became a city in 2000. The urban
population increased in percentage in 2007 but declined in 2010 and again increased in 2015. The
gross population density is 609 persons per square kilometer or 6 persons per hectare. Urban
barangays have a density of 22 persons per hectare while the rural barangays have 14 persons
per hectare. Sirangan, Sampaloc is the densest.
Population Composition
The population of Sorsogon as per National Statistic Office census of 2015 the total
population is recorded at 168,110. Previously recorded total population from the previous census
year 2010 is at 155,144.
The population of the city increased 1.54 percent annually, on average, for the period
2010 – 2015. The male population is slightly higher having a gender ratio of 1.02.
The City has 66.35 percent of its population comprising the labor force. These are the
population with age 15 and over. Ages 15 to 64, or the working age population comprises 61.05
percent of the total population. The total dependency ratio is 64.77% with young dependency
ratio of 54.8 and old dependency ratio of 8.98%. This shows that for every 100 working age
population, there are 65 dependents, 55 of which are young and 9 are old.
The school going-age population (5-24 years old) is 44% of the total population. 22%
comprise the elementary school age population, 14% compose the secondary school age
population, while the tertiary school age population is 8%.
In terms of sex ratio, there are more males in the school going age population in all levels.
There are 107 males for every 100 females. Same is true with the working age population.
However, for the labor force, there are almost the same number of males and females. The young
male dependents are greater while the male old dependents exceed the females by almost three
fourths.
Population Density
The gross density of Sorsogon City is 609 persons per square kilometer or 6 persons per
hectare, considering the more than 6,000 hectares geothermal reservation area. With a built-up
area of 748 hectares, this results to a density of 213 persons per hectare.
Among the urban barangays, Sulucan, Sirangan, Talisay, Burabod, Bitan-o, Almendras,
Polvorista and Sampaloc are the most dense barangays with more than 100 persons per hectare.
Barangays with the highest population such as Bibincahan, Pangpang, and Cabid-an have large
gross areas ranking them second to the group of tens.
In terms of density built-up area, Bibincahan, Pangpang, and Cabid-an rank among the
first three biggest barangays.
Table 1. Based from the 2010 and 2015 population count, Sorsogon City has a
growth rate of 1.54.
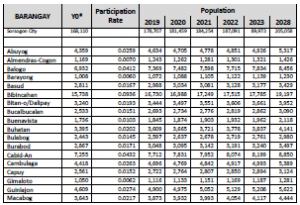
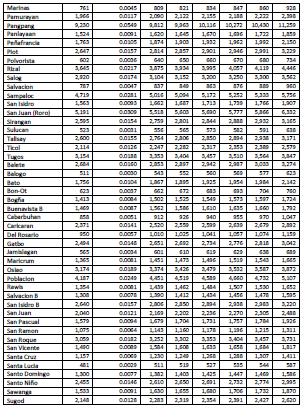
Table 2. Projected Households
Urbanization Level
Sorsogon City started as two separate municipalities before becoming a city in year 2000.
The former Municipality of Bacon has only Barangay Poblacion as its urban barangay classified by
NSO (now PSA). While the former Municipality of Sorsogon has 10 barangays classified as urban.
This has expanded through a legislation of the Sangguniang Bayan in 1981, expanding the area to
the Poblacion (urban area) adding 7 barangays to the urban center. Sorsogon City since the
merger, has now a total of 18 barangays comprising the urban areas. Considering population and
proximity to the urban center, and presence of facilities, three barangays can be considered
urbanizing. These are barangays Cambulaga in West District, Balete and San Roque in Bacon
District.
The level of urbanization of the combined municipalities of Bacon and Sorsogon declined
from 1990 until 2000. It escalated in 2007, declined in 2010 and again intensified up to 2015.
Sorsogon City has almost half of its population living in the urban areas. Of the 64 barangays, 18
are considered urban barangays and 47 percent of the population lives here. The increase in urban
population maybe associated with job opportunities, education, and migration from other
municipalities.
Projected Population by Barangay
The population projection by barangay used the participation rate process to come up
with the projected population 2019 to 2028. The 2015 population of the barangay is computed in
terms of its contribution to the Sorsogon City. The same computation follows for the projected
population of the city as its basis.
Bibincahan is projected to be almost 20,000 and Pangpang to be more than 11,000 by
2028. Cabid-an and Balogo East District follows with more than 8,000. For the urban barangays,
the least projected population is Polvorista and Sulucan while for the rural barangays, Sta Lucia,
Bato, Jamislagan, Bon-ot and Balogo, all of Bacon District, will have more than 500 to less than
800 population.
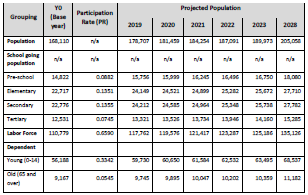
Table 3. School going age projected
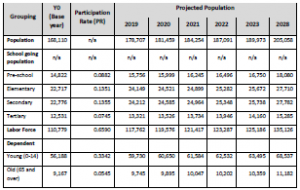
The age group with the highest population are ages 5 to 19. These are the school going
age population and the three age groups account for more than 33 percent of the total population
in 2015. The same age groups account for 36 percent of the 2010 total population. In terms of
gender the age group of male 54-59 registered the highest increase in 2015 compared with the
same age group in the 2010 population. The age group of 20-24 however has the highest increase
in percentage for the female population.
Young old dependents is to increase to 63,495 by 2013 and 68,537 by the end of the
planning period 2028. For old dependents, this is expected to increase to 10,359 by 2023 and
11,182 by 2028. All are assumed to have a constant growth rate.
The labor force will have a significant increase of more or less 25,000 by the end of
2028. The number of persons within this age is expected to be 135, 126 by 2028.
Sorsogon City lies from 123° 53’ to 124° 09’ east longitude and from 12° 55’ to 13° 08’
north latitude. It is 600 kilometers southeast of Manila and is located at the southernmost tip of
Luzon. As part of the geographical chain linking Luzon to the rest of the Philippines, it is a
transshipment corridor and serves as the gateway city to the Visayas and Mindanao Islands. Its
geographical location is such that it opens into both the Pacific Ocean (through Albay Gulf) and
the China Sea (through Sorsogon Bay and Ticao Pass). The city is bounded on the east by the
municipalities of Pto. Diaz and Gubat, on the south by the municipality of Casiguran and Sorsogon
Bay, on the west by the municipality of Castilla, on the northeast by the municipality of Manito in
Albay, and on the north by Albay Gulf.
Sorsogon City has an area of 27,600 hectares or 27.6 square kilometers. The shared
boundary with Pto. Diaz on the east is 10.64 kilometers and with Gubat municipality is 15.27
kilometers. On the south, adjoining boundary with Casiguran is 3.37 kilometers. The adjacent
Municipality of Manito, Albay Province has 15.56 kilometers boundary and with Castilla on the
west is 8.38 kilometers.
Sorsogon City has a coastline of 39.3 kilometers along Albay Gulf and approximately 33
nautical miles bordering the municipal waters with the municipalities of Manito, Rapu-rapu, and
Pto. Diaz. Along the Sorsogon Bay, the coastline stretches to 29.4 kilometers and 22 nautical miles
bordering the municipal waters of Casiguran, Juban, Magallanes, and Castilla. The total area of
the municipal waters of Sorsogon City is approximately 266 square kilometers for the two bodies
of water, 20,041 hectares at Albay Gulf and 6,609 hectares at Sorsogon Bay.
Sorsogon City is divided into three districts, East, West, and Bacon districts. East district
has 14 barangays, West district has 22 barangays, and 28 barangays for Bacon District. Of the total
64 barangays of the city, 18 are urban barangays while 46 are considered rural barangays. The
urban barangays land area totals 3,977.95 hectares or 14.78% of the city’s area. The rural
barangays total land area is 23,521.37 or 85.22% of the total area. Barangay Bibincahan ranks first
in terms of area among the urban barangays while Barangay Osiao is the biggest rural bararangay.
The smallest urban barangay is Polvorista and Cambulaga as the smallest rural barangay.
Figure 2. Location Map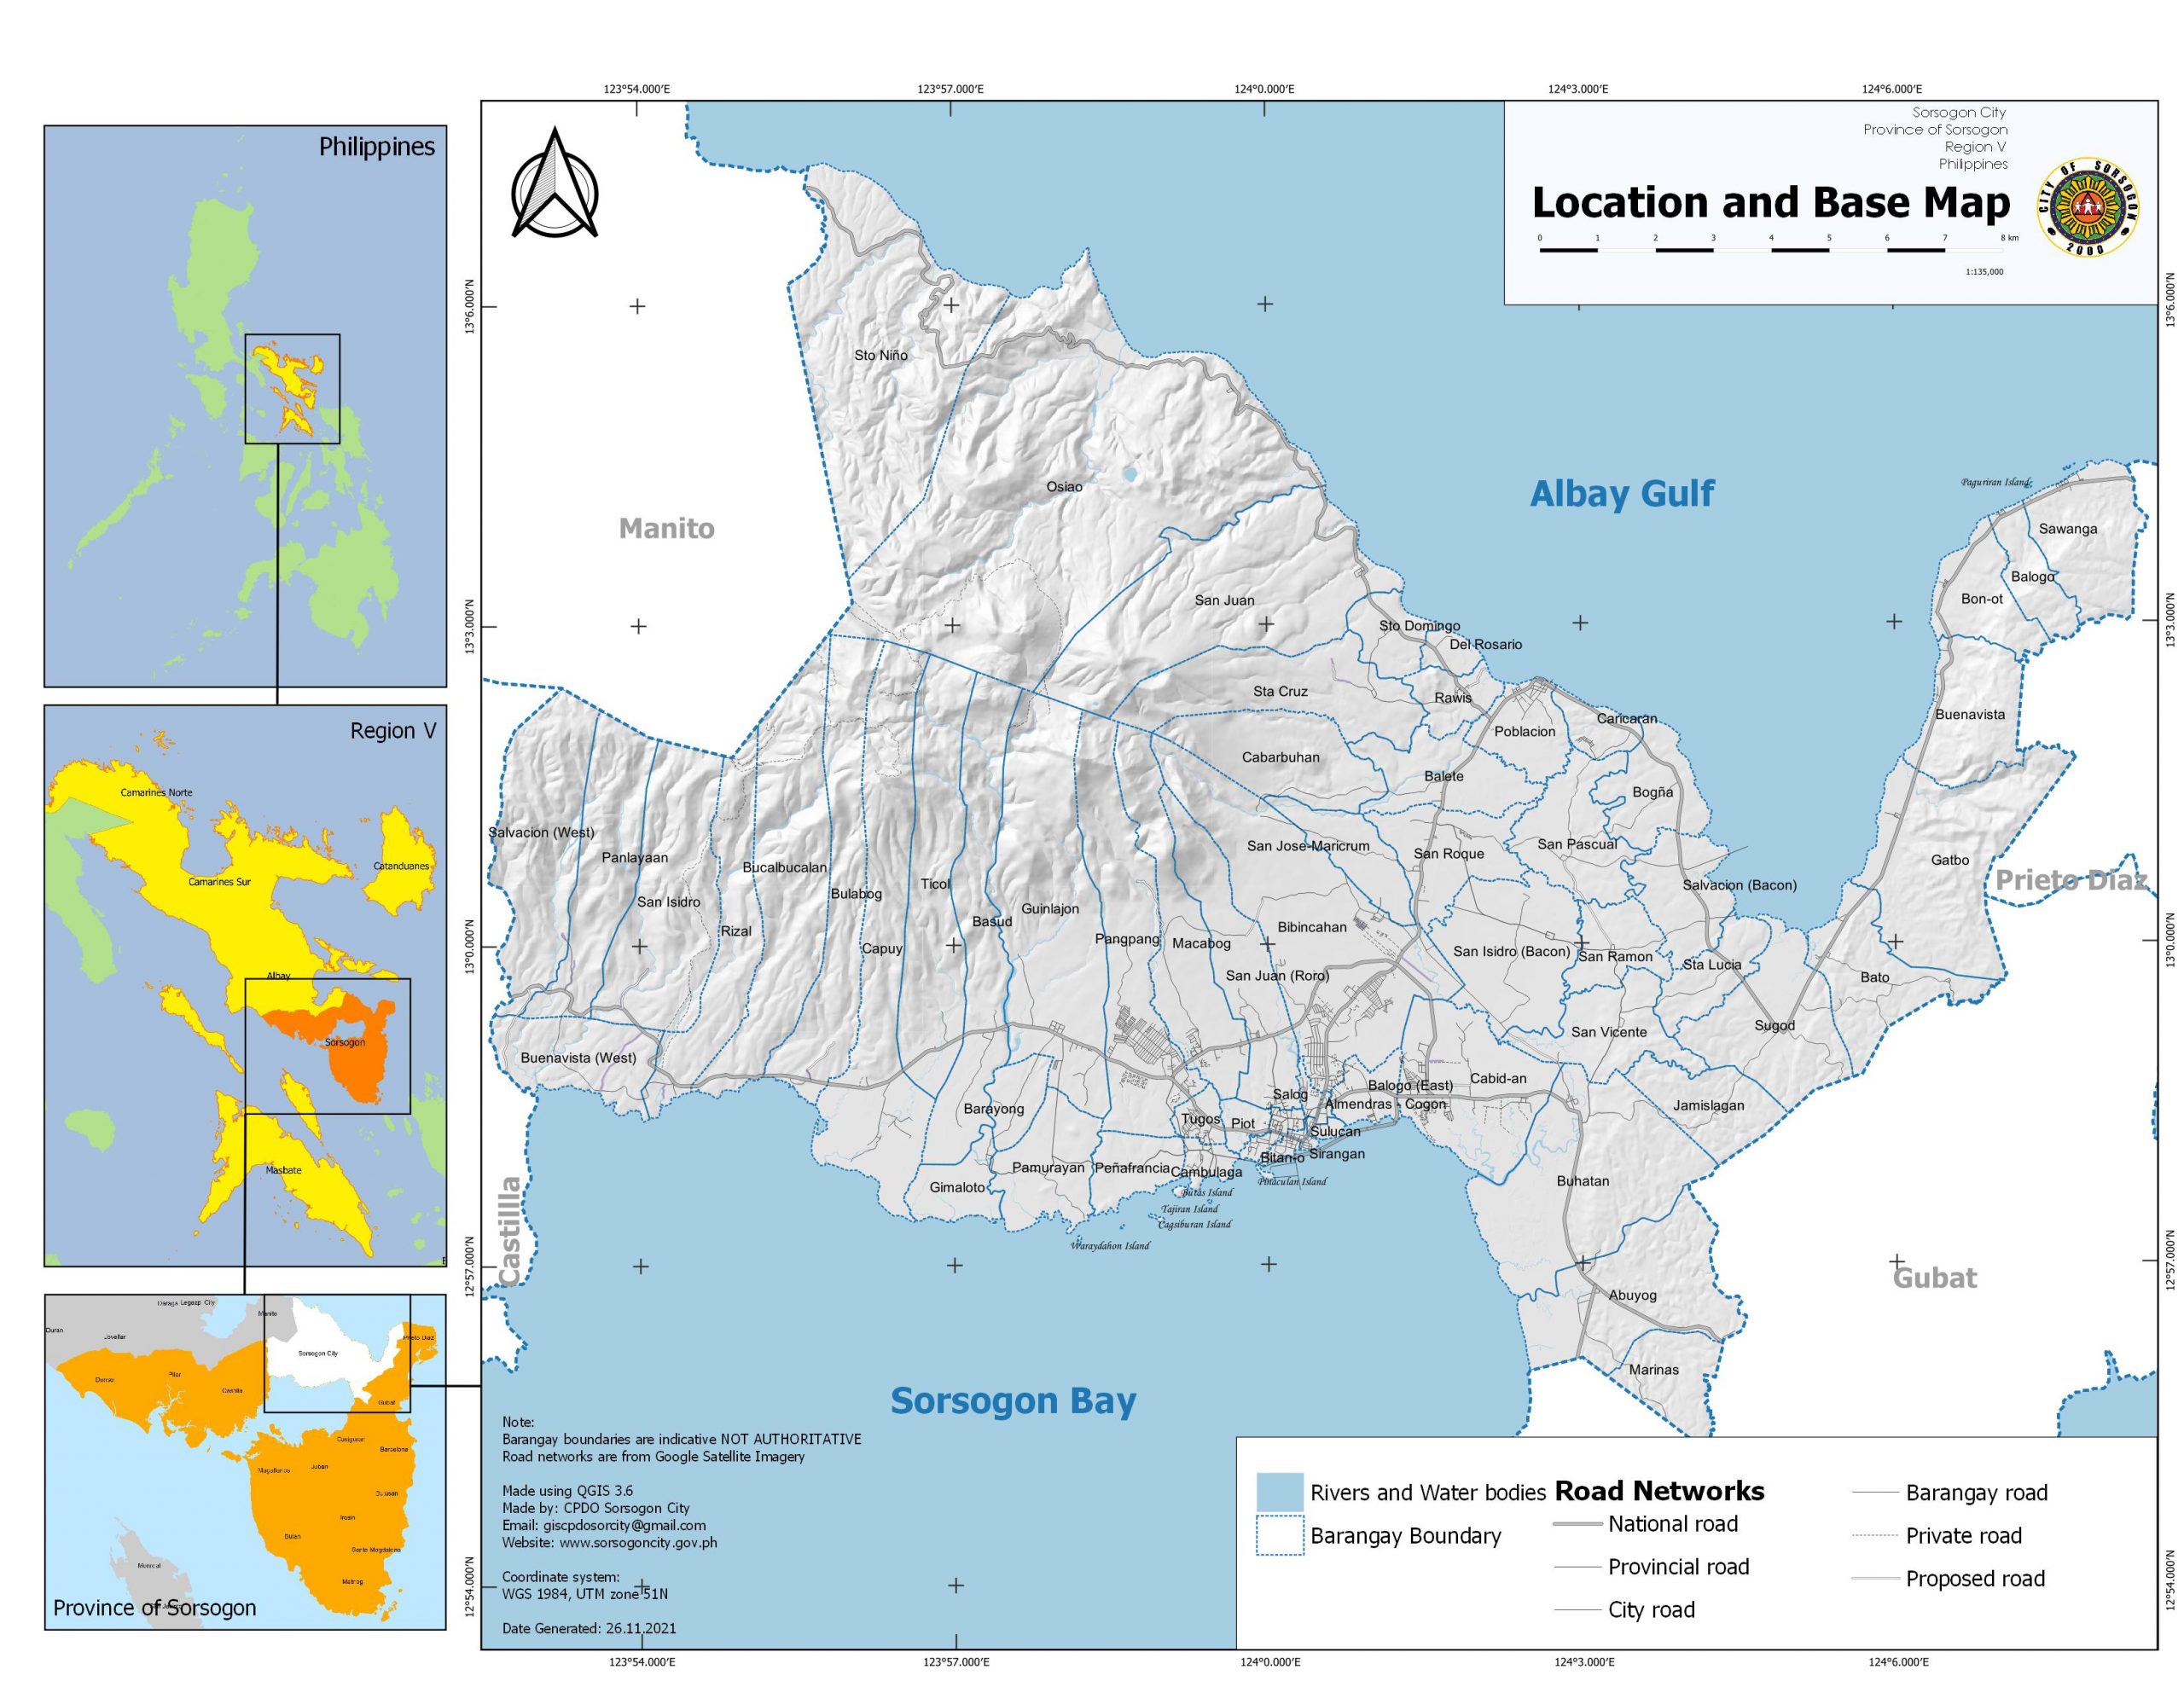
Topography
Sorsogon may be divided into four physical areas—the northeastern range, the
sloping uplands, the plain area, and marshlands.
The northeastern range is part of the Bacon-Castilla range, bordering Sorsogon’s
north and serves as its watershed covered mainly by secondary forest growth and thicket. It
starts from 200 m above sea level to Mt. Rangas, the highest point at 1,000 meters. The
sloping uplands are the shoulders of the range and the series of hills in the southeast.
Coconut, abaca, and fruit trees cover this area. The plain is generally low and level.
Settlements and other built-up areas and ricefields occupy the plain area. Marshlands are the
mouth of rivers vegetated mainly by nipa and are developed into fishponds.
Elevation
Elevation starts from 0-100 meters above sea level (masl) to Mt. Rangas, the highest point
at 1,000 meters. The sloping uplands are the shoulders of the range and the series of hills in the
southeast. Coconut, abaca, and fruit trees cover this area. The plain is generally low and level.
Settlements and other built-up areas and ricefields occupy the plain area. Marshlands are the
mouth of rivers vegetated mainly by nipa and are developed into fishponds .
Slope
Sorsogon City has a large area suitable for urban use in terms of slope. These are areas
with equal to or less than 30 percent grade. This accounts to more than half of the city’s area.
Steep slopes suitable for forest use are situated within the geothermal site reservation area.
Table 4. Slope
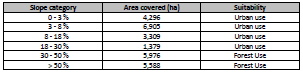
Suitability of Land for Urban Use
Of the total area of the city, a total of 15, 800 hectares or 58 percent is below 30% grade
in slope which are suitable for development in urban use. The remaining areas have slopes above
30% grade and are suited only for forest use. Table 4 refers to suitability areas for urban use.
Drainage Pattern, bodies of water Surface Drainage
A system of rivers and creeks and several small waterways drain the area. The northern
half of the city is drained by rivers and creeks that empty to Sugod Bay and Albay Gulf. The
southern half is drained towards Sorsogon Bay.
Fresh water rivers, when reaching the lowlands have been tapped for irrigation and domestic
uses. Brackish ones are source of shrimps and shellfish.
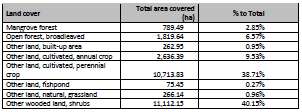
Vegetation/vegetative cover
Table 5. Land cover
Soil
Type/Classification
Dominant soil types are Annam clay loam. Annam clay loam has a relief of slightly
undulating, roughly rolling to undulating. It covers about half of the area. It is suited to lowland
rice, root crops, vegetables, and permanent planting. Sorsogon clay loam, is the soil on the plains
and valleys. It is suited to lowland rice, abaca, and corn. The rest of the soils are Bascaran clay
loam, Castilla clay loam and Casiguran clay loam.
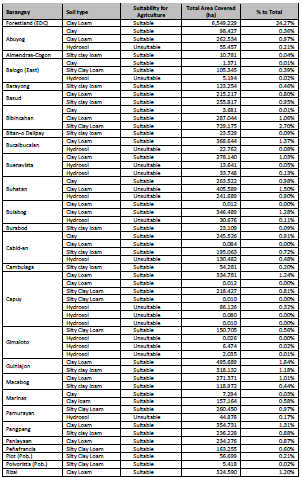
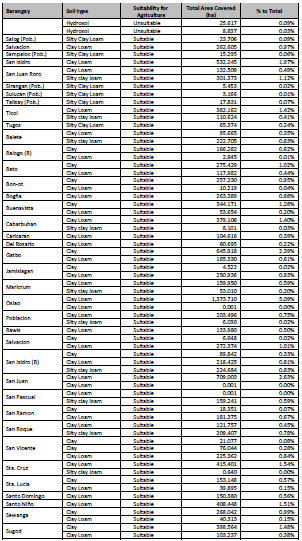
Soil Suitability
Sorsogon City is endowed with soil type or 96% of its area suited for agriculture. While
elevation and slope are also a factor, agricultural area is limited to lower areas. The loamy soil
type makes it suitable for agriculture.
Table 6. Suitability for Agriculture
Suitability of Land for Urban Use
Of the total area of the city, a total of 15, 800 hectares or 58 percent is below 30% grade
in slope which are suitable for development in urban use. The remaining areas have slopes
above 30% grade and are suited only for forest use. Table 6 refers to suitability areas for urban
use.
Hydrogeology
Geology
The northern part of Sorsogon is made up of andesitic lava flows and other volcanic rocks.
Rocks in the northeast are coralline limestone which are now being quarried for marble produced
by different episodes of volcanic intrusions. Mt. Rangas and Mt. Poctol maybe dormant or extinct
volcanoes with the present lakes as their mouths. The rest of the flatlands are recent alluvial
deposits composed of clays, silt, sand, gravel and corral. Geothermal energy has been successfully
exploited in the northern part of the city, including areas Manito. From wells drilled and
developed by the Philippine National Oil Corporation, the National Power Corporation is
operating three plants with a capacity of 130 MW connected to the Luzon grid. As to non-metallic
minerals, the Bureau of Mines and Geosciences has determined a sulfur deposit of 755 metric
tons in Rizal. Its grade ranges from 10% to 40%. Gravel and sand can be quarried at the Cawayan
River.
Ground Water Resources
Ground water is the primary source of drinking water in the city dispensed by the
Sorsogon City Water District (SCWD). Sources includes: Baribag, Peñafrancia Seminary, Sea
Breeze Homes, Imperial Subdivision, Villa Alegre Subdivision, Abuyog 1 and 2, Cabid-an, Guinlajon
and San Pascual. It is also the main source of BAWASA.
Climatological conditions
Generally, the climate of Sorsogon is under Type II of the Coronas classification system.
Under Type II, there is no pronounced dry season but with a very pronounced maximum rain
period from November to January. Sorsogon City’s annual rainfall range from 2,800 mm to 3,500
mm. Rain is expected 200 days in a year and even in the driest months unexpected downpour
occurs.
Atmospheric temperature and relative humidity in the Sorsogon City range from 21°C to
32 °C. Relative humidity is 82%. Prevailing air stream systems are the monsoons and Pacific Trade
Winds
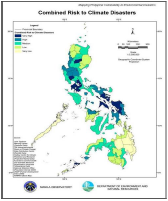
Figure 3. Combined Risk to Climate Disaster Map
which pas over Sorsogon City and cause variations to climate. The Northeast Monsoon (Amihan)
occurs/ dominates from October to March and brings significant amounts of rains. While the
Southwest Monsoon (Habagat), occurs from June to September and during these months, the
area is warm and very humid thus, increasing rainfall rates The Pacific Trade Winds (Gurang na
Habagat) occurs during April and May significantly raise temperatures (City Ecological Profile,
2015).
The climate is tropical in Sorsogon City. The same has a significant rainfall throughout the
year. The city experiences a lot of rainfall even during the driest months. The climate here is
classified as Af by the Köppen-Geiger system. The average annual temperature is 27.1 °C in
Sorsogon City. The average annual rainfall is 3089 mm.
The driest month is May. There is 139 mm of precipitation in May. Most precipitation falls
in December, with an average of 487 mm.
Climograph of Sorsogon City
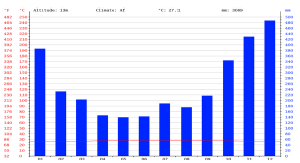 Figure 4. Climotography of Sorsogon
A. Temperature Graph of Sorsogon City
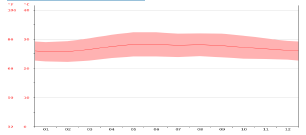 Figure 5. Temperature Graph of Sorsogon City
With an average of 28.2 °C, May is the warmest month. In January, the average
temperature is 25.7 °C. It is the lowest average temperature of the whole year.
Surface Waters
A system of rivers and creeks and several small waterways drain the general area of the
city: Salog River is an urban river originating from Mt. Alinao and traversing eight barangays before
discharging into the Sorsogon Bay. San Isidro, Rizal, and Cawayan Rivers originate from springs
and tributaries of secondary forest areas within EDC Geothermal Reservation including the Bacon
District or northwestern rivers of the city. Rivers in Bacon District, at the northwestern to
northeastern portion of the city, drain to the Albay Gulf. These include Luluwasan Osiao, Gatbo,
and Rangas Rivers. Rivers in the southwest & south namely San Isidro, Cawayan, Salog, and
Abuyog Rivers at the East & West District drain into the Sorsogon Bay.
Fresh water rivers, upon reaching the lowlands, are often tapped for irrigation and
domestic uses. Brackish ones are source of shrimps and shellfish. Water resources in the City are
generally classified into surface and groundwater. Springs (Table 4) and networks of creeks and
tributaries at the upland converges at the down streams to form major river systems. The Major
river systems of Sorsogon City is shown in Table 5.
Existing Land Use
The commercial district of Sorsogon remained physically the same in area for the past
20 years. Existing settlement pattern tends to expand along the three strips defined by the
roads going to Legaspi City to the west, to Bacon district northward, and to Gubat eastward.
This development is partly due to the absence of circumferential and radial roads. Satellite
communities are present in Pangpang, Bibincahan, and Cabid-an.
Of the total area of 27,600 hectares, Sorsogon City has a total built up area of only 1,878
hectares or 7 percent of the city’s area. Agricultural use dominates the area with 19,772 hectares
or 72 percent of the total area. The forest area which is included in the reservation area where
the geothermal plant is located, has an area of 5,981 hectares or 22 percent of the total area.
The city’s municipal waters cover both portions of Sorsogon Bay and Albay Gulf. The
Sorsogon Bay portion shared with other 7 municipalities cover 25.545 hectares. This is used as
fishing ground of the small fishermen, green mussel farm, and fish culture.
Land Use Trends
Sorsogon City started with two urban centers from the former municipalities of Sorsogon
and Bacon. Sorsogon municipality started with 11 urban barangays and grew to 17 during the
1970’s while Bacon municipality remained with one urban center. The former expanded along the
main highway in three directions covering now Pangpang, Bibincahan, and Cabid-an. Barangay
Poblacion remained as the urban center although expansions are reaching Caricaran, Balete and
Rawis. Residential subdivisions have changed the agricultural areas to residential and commercial
uses particularly in the perimeter part of the urban areas.
After the merger into a city, more land use changes occurred. The construction of the
diversion road opened development along the highway covering the barangays of Cabid-an,
Bibincahan, San Juan, Macabog and Pangpang. The inauguration of the City Hall in 2007 marked
the opening of the satellite city,a planned unit development composed of institutional,
commercial and residential uses along the diversion road. Residential, commercial, institutional,
and industrial uses are now present in these areas. The same land use changes occurred in
portions of Guinlajon, Cambulaga, San Roque, and Balete with the pressure of development.
Figure 6. Existing General Land Use Plan
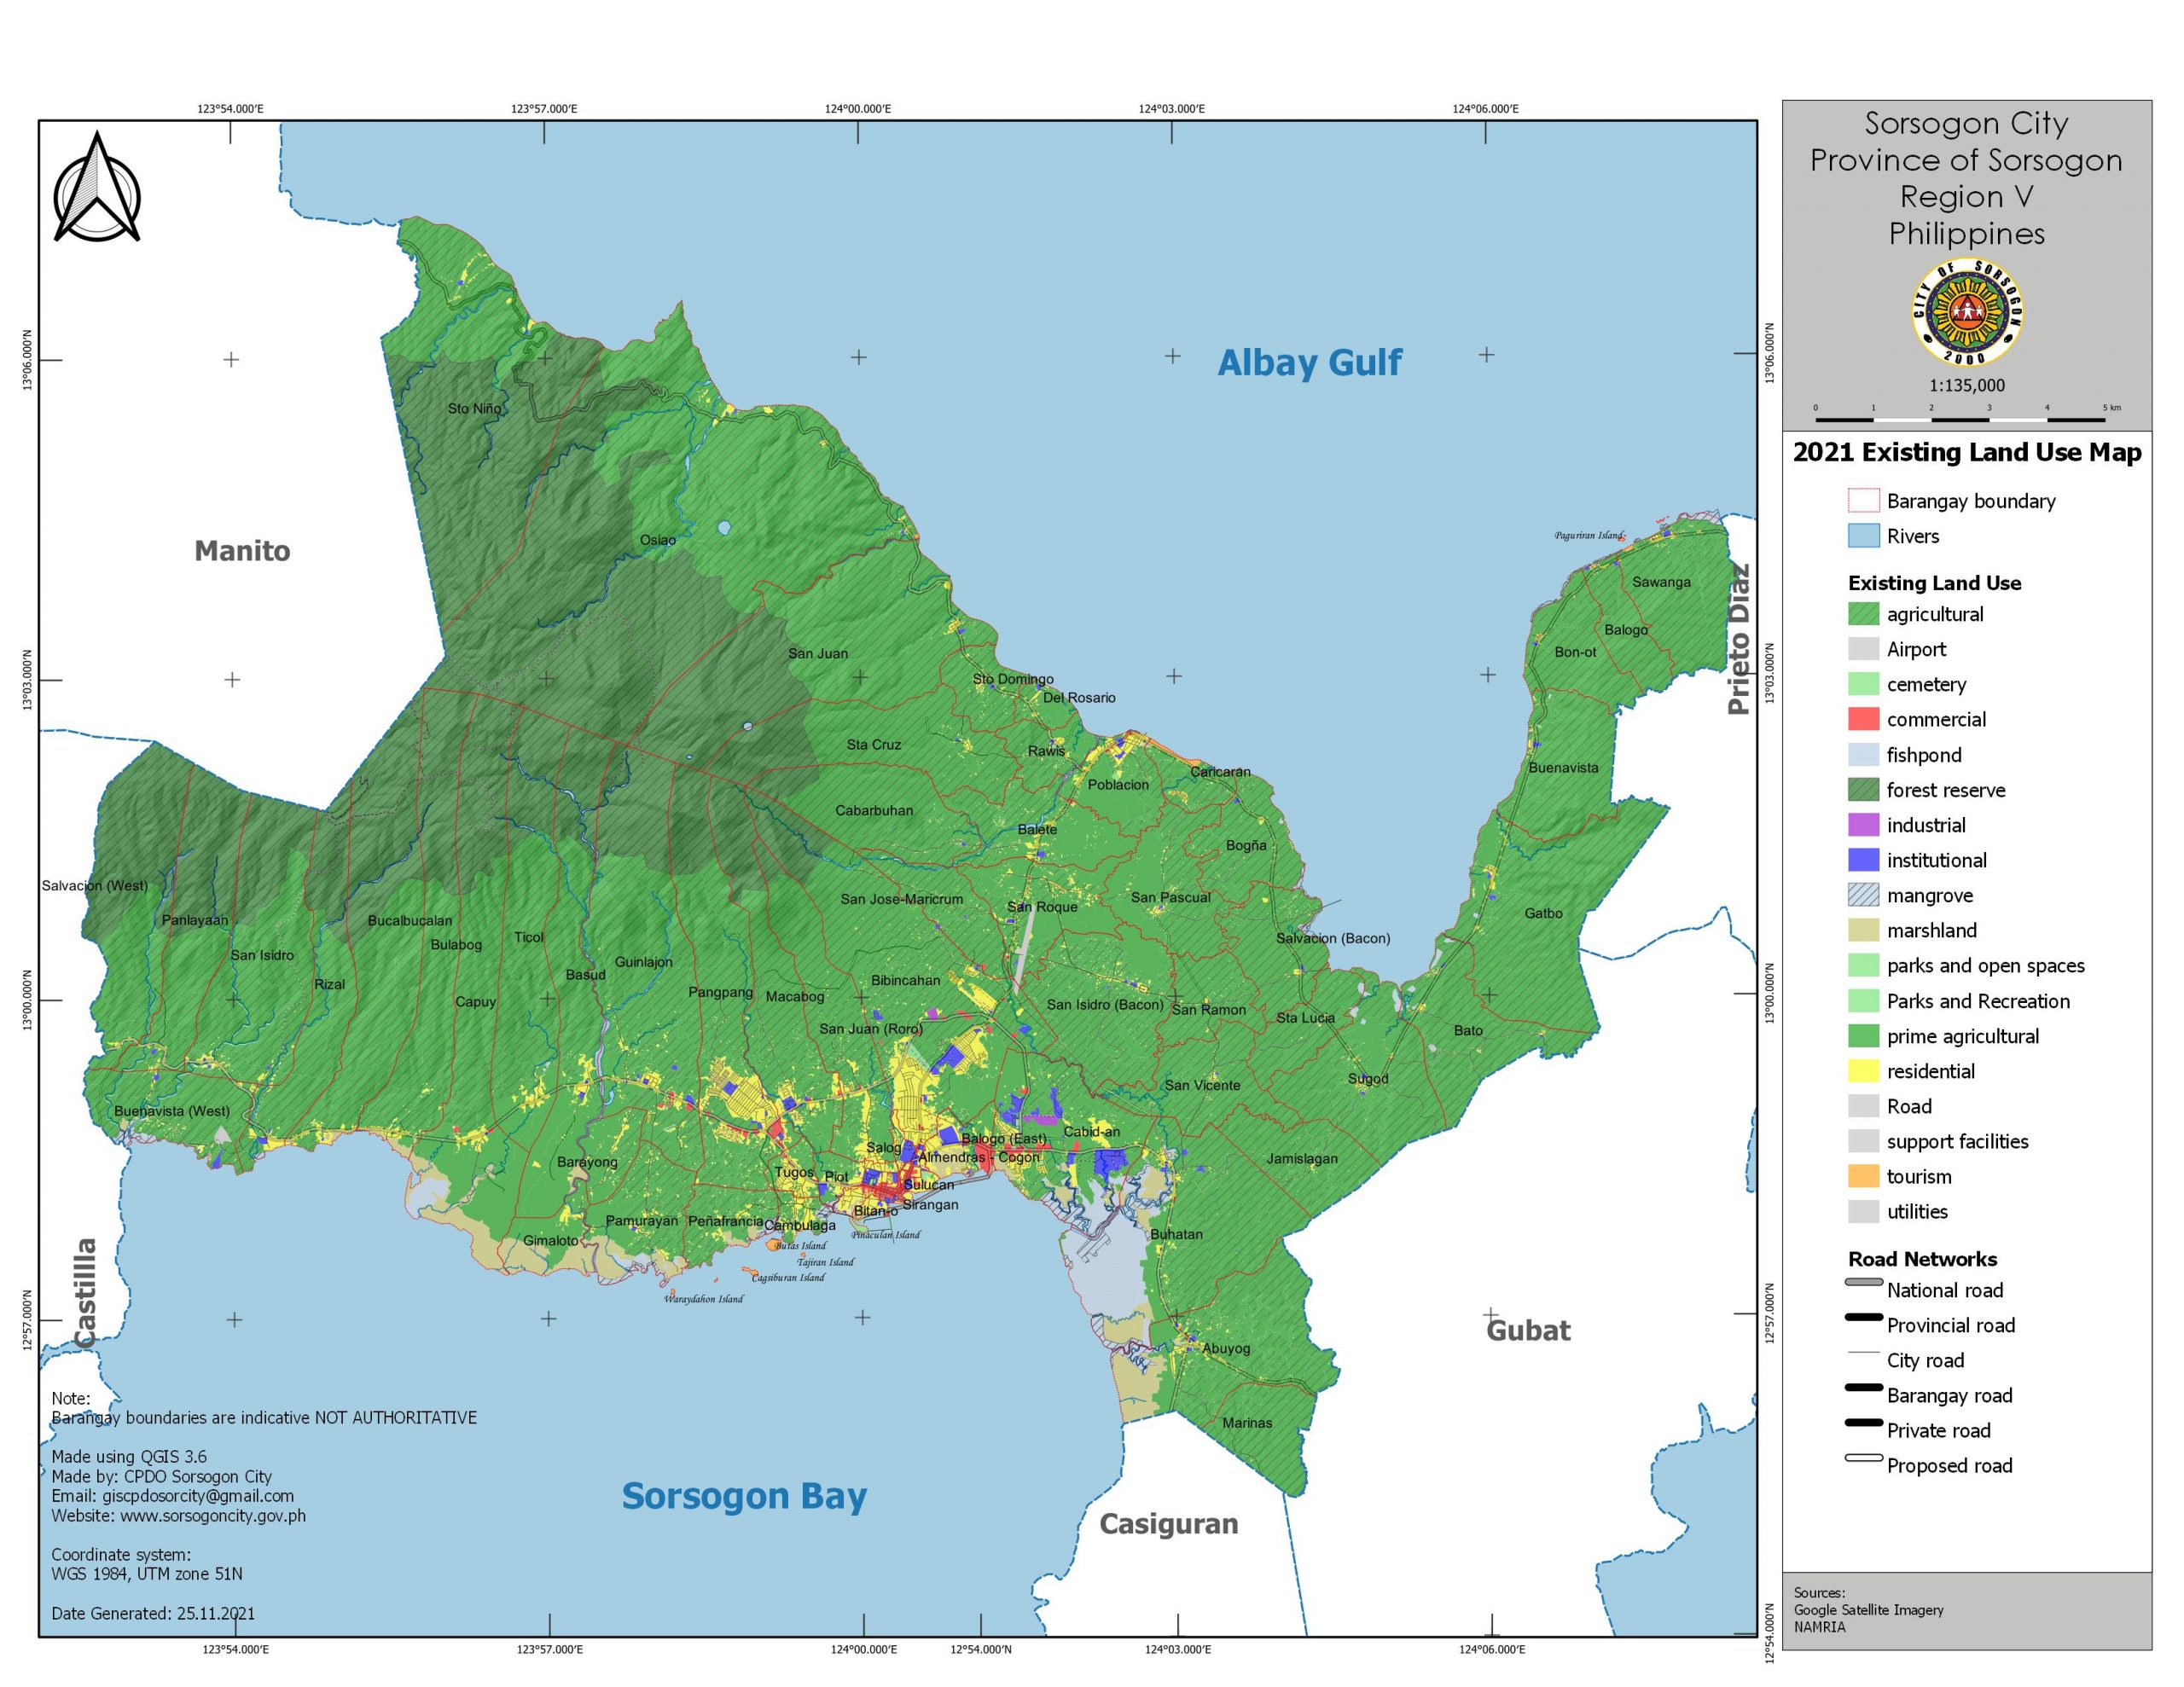
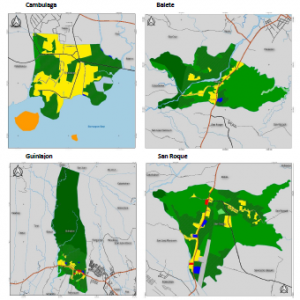
Figure 7. Cambulaga, Balete , Guinlajon & San Roque
Agriculture lands including prime agricultural land has been affected by the pressure of
these developments. The expansion of the urban center with the formerly conceived “satellite
city” now a city government center leads in areas with most new infrastructures. An industrial
coconut processing facility and hospital now occupies former agricultural lands in the diversion
road. Permanent commercial establishments likewise have developed in Cabid-an along the
diversion road and national roads.
On the southern part of the city, the coastal portion of Sirangan and Talisay has turned
into an amenity and leisure center. A bypass road is on-going, which will link Cabid-an and
Pangpang without getting into the urban center through a coastal road.
The development in the East and West districts continued not only in-filling but with vertical multistorey
structure development in some areas.
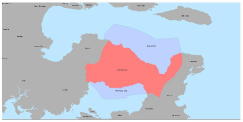
Figure 8. Policy Zones and Development Strategies
Parallel with the objectives of disaster risk reduction, policy zones were identified to guide
the development and used as screening criteria before implementing identified projects.
Development is deemed to be useless if it will just be damaged by climatic and geologic hazards.
Recognizing the importance of disaster risk reduction in development, the following objectives
are aimed in formulating these:
Minimize impact of disaster to people. As much as possible to people no casualty during disasters
or zero casualty. In terms of recovery, the objective is for the victims to recover fast from the
impacts of disaster.
Minimize damage to physical development. Developments and infrastructures shall at least
protect the existing development in high-risk areas. These maybe part of long-term plans for
relocation of development in high-risk areas. Future development shall be located in identified
safe or low risk areas to hazards.
Encourage mitigation and adaptation measures for those in high-risk areas. Disaster risk
mitigation involves infrastructure and non-infrastructure measures to lessen impact of disaster.
Climate change adaptation will be using measures to lessen impact of disaster living with the
hazards. Climate change mitigation is using measures which will reduce carbon footprints thereby
helping the effects of climate change.
Protect prime agricultural lands and environmental assets. Protecting prime agricultural lands will
at least help rice self-sufficiency of the city. This is also saving and making use of the irrigation
systems built for such areas. Sustainable development also means protecting environmental
assets such as forests, rivers and other natural bio physical environment for current and future
use.
Each policy zone is defined be based on the type and level of risk in the area, its
topography, and its dominant land use. Each policy zone will also have its own development
strategy to guide the land use and to harmonize programs, projects, and legislation/policies
specific to that area.
- Includes major physical infrastructure projects (i.e. major dams/energy facilities,
regional/sub-national transport/road network and facilities, etc.) - Infrastructure and road network maps at 1:50,000 (provincial-municipal);
municipal/city-level local road network at 1:20,000 or suitable scale
Infrastructure (2016 Resource generation and utilization – construction materials and land use)
- The city imported in 2016 the following construction materials:
- Steel 2.55 kilo tons
- Sand – 21 kilotons
- Cement 9 kilotons
- Hollow blocks 18 kilotons
Coconut lumber is the sole construction material produced in the city- The dwelling density of Sorsogon City was computed at 539 persons per square
kilometer - Population 168,110, rural – 88,898, urban – 79,212
- Local public transportation route plan (for completion)
- Road network
- 5.6 Transportation Network (Internal and External Linkages)
- For air transport, it is also available via 45-minute flights, which land in Legazpi City. Plane
trips are served daily by the Philippine Airlines and Cebu Pacific that have regular early
morning flights to and from Manila. From there, travel time to Sorsogon is from one to 1
½ hours’ time to Sorsogon City by land via PUV’s, Fx vans or buses. The Sorsogon Airport,
a secondary airport, except for chartered flight in 2002, it has no commercial flights at
present although Air Manila flies twice a week in early 1960’s. A small building serves as
facility for the airfield. It needs rehabilitation for it to be serviceable. - For land transport, Sorsogon City can be reached via land transport from Manila by bus
or private vehicle. Travel time is around 12 hours, depending on traffic conditions. The
city accounts for a high passenger volume as bus lines of other southern provinces and
municipalities have designated Sorsogon as their pick-up point. A total of twenty-seven
(27) registered (with mayor’s permit) buses from two (2) bus companies have destinations
from Sorsogon City to Legaspi City and Bulan or plying Bulan – Legaspi City just unloading
passengers bound for Sorsogon City as shown in Table 5.7. - A total of five hundred forty-four (544) jeepneys that is the primary mode of
transportation within the city particularly in Bacon bound, south bound, and west bound.
Jeepneys are the mode of transportation when going to Bacon District, second district
municipalities outside Sorsogon’s perimeter can also be reached by public utility jeepneys
while three thousand and two hundred sixty (3,260) tricycles is the mode of
transportation from barangay to barangay, barangay to city, and within the city. Aside
from public utility jeepneys and buses, one hundred and thirty-six (136) UV Express vans
also serve the Sorsogon City-Legaspi City route. - Ongoing
- Coastal road Talisay to Cabid-an
- Pangpang to Talisay bypass road
- Urban roads
- Costal road-Rizal Street connection
- Coastal road – Mons Barlin Street
- Coastal road – Barangay Road (Mahingan)
- San Juan roro – SPPVS Bibincahan
- Widening/Clearing of urban roads
- Installation of traffic lights
- Installation of street lights
- Rural roads
- Opening/concreting of FMRs
- Completion/Widening of Bacon Pto. Diaz Road
- Completion of Bacon Manito Road
- Concreting of barangay roads
- Includes major physical infrastructure projects (i.e. major dams/energy facilities,
regional/sub-national transport/road network and facilities, etc.) - Infrastructure and road network maps at 1:50,000 (provincial-municipal);
municipal/city-level local road network at 1:20,000 or suitable scale
Figure 9. Road Network
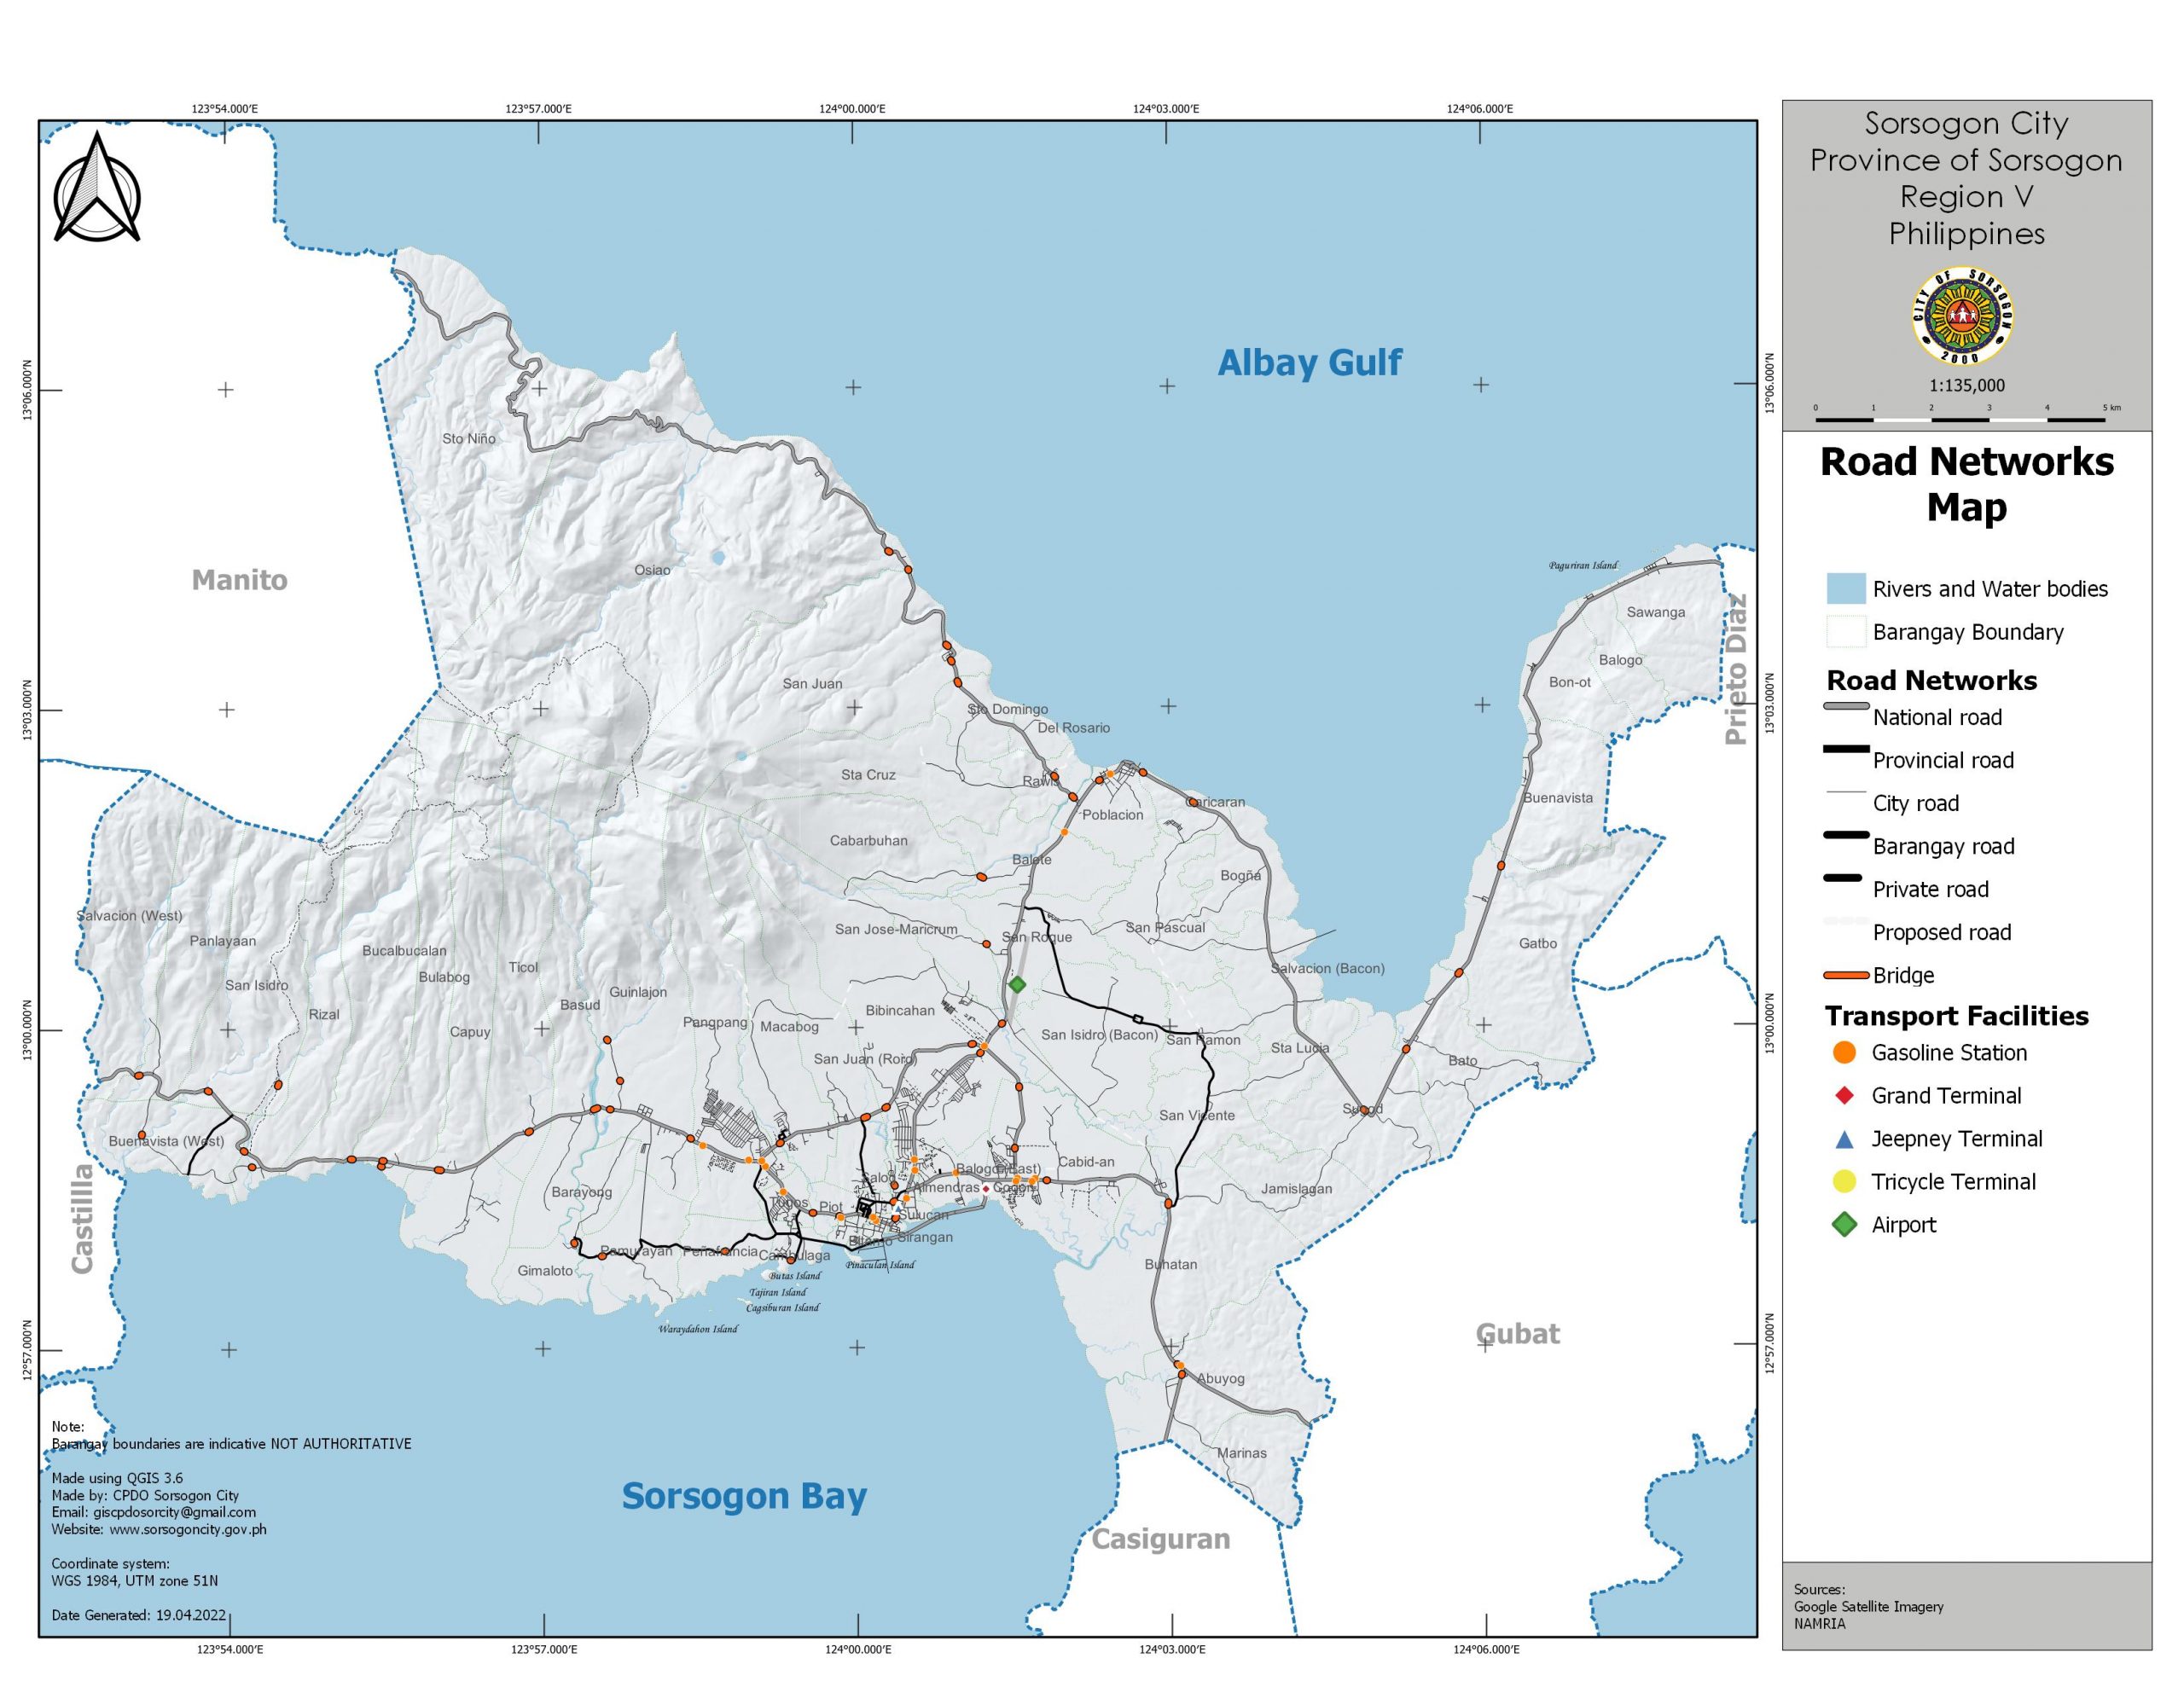
- Includes major physical infrastructure projects (i.e. major dams/energy facilities,
regional/sub-national transport/road network and facilities, etc.) - Infrastructure and road network maps at 1:50,000 (provincial-municipal);
municipal/city-level local road network at 1:20,000 or suitable scale
Agriculture
Rice (Resource generation and utilization of Sorsogon City)
- Only 70% of the population can be supplied by local producers
- The city’s food sufficiency can be in a dire position in the future if the increasing
population trend continues, while no additional farms are made available - Annual production of palay is 19,818.71 metric tons
- Yields to 12,882.16 metric tons annual rice production
- A part of which is 62.92 metric tons equivalent rice used as seeds
- 73% of the total land area is agriculture
- 10.5% of the agricultural lands in the city is devoted to rice production
- Each Sorsoganon consumes about 109 kilos of rice per year
- The city imports 1,335.85 tons of chemical fertilizer per year
- The whole city generates a total of 18,194.8 metric tons of biodegradable waste per
year - Organic fertilizer locally produced could easily supply the fertilizer requirement of the
whole rice producing sector.
Food (Resource generation and Utilization – Food)
- Each Sorsoganon consumes an average of 0.24 tons of food annually while generating
0.066 tons of food waste at the same time - The city imports 49.2% of its total food consumption requirement, despite the fact that
it relies on agriculture as the primary economic driver. - Each Sorsoganon wastes food at a rate of about 0.18 kilos per day which translates to 66
kilos per year - Sorsoganons waste 27.5% of the food they consume, or equivalent to 11,292.13 ton for
2015 - Annual biodegradable waste generated by the whole city is 18,194.8 tons, an immense
source of potential organic fertilizer. - Rural food consumption is 20,493 tons of food in 2015.
- Urban food consumption is 20,604 tons of food in 2015
Table 7. Agri-Fishery Area, Problems and Challenges & Priority Interventions
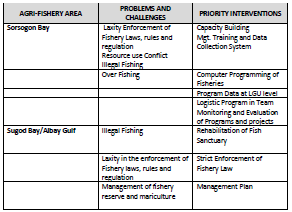
Table 8. Agri-Fishery Area & Prospects/ Opportunities
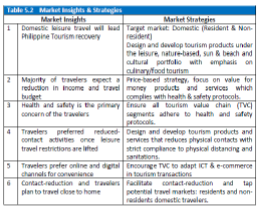
Strategic Tourism Development Framework (STDF) of Sorsogon City
The tourism development framework of the plan outlines the vision, goal and strategic
objectives with the corresponding programs, projects and activities (PPAs) under the marketing
and development programs integrated in the investment and implementation plan with
monitoring and evaluation mechanism.
The STDF as shown in Fig. 5.1 examines the comparative and competitive advantages of
Sorsogon City by asking the question: “Where are we and how do we compare with others?” This
is to determine the status of the local tourism industry through situational analysis by examining
both its external and internal ecosystems from macro to micro perspective such as, assessment
and evaluation of its tourism resources classified into inherited or natural assets; created or built
and complementary. The global, national and sub-national tourism markets, demands and
patterns were also reviewed to understand development trends and performance of the
competitors in comparison to the city tourism industry. The development potentials and
challenges by the tourism value chain (TVC) segments was further analysed together with its
relationship to support industries and its structure to better understand how to improve or
enhance each segment that will strengthen the whole value chain in response to the volatile,
unpredictable, complex and ambiguous (VUCA) environment particularly in the age of the growing
threat and crisis such as the COVID-19 pandemic.
The visioning, goal setting and strategizing processes answers the question: “Where
would we like to be in the next five years?”. But, most importantly to answer: “How to get there?”
or how to realize it, points significantly to the marketing and branding strategies and the
understanding of the key success factors and capabilities such as the policy setting, project
management and implementation including activities integrated into the strategic development
and marketing programs with institutional management and monitoring not only to merely attain
those aspirations but also to answer the question: “How to stay ahead?” or maintain global
competitiveness.
The Vision & Goal
The Sorsogon City Tourism Development Plan (SCTDP) adapted the city government’s
vision of “A model city in climate change and disaster risk resiliency with a contented,
empowered and values oriented society that pursues socio-economic development within the
limit of nature thru genuine commitment to good governance” as stated in the Comprehensive
Land Use Plan (CLUP). The SCTDP is not a separate rather an integral component of the holistic
CLUP of the city which focuses on enhancing the local tourism industry. Thus, it imbibes the
sustainable tourism principles as its core foundation in attaining its goal to become “A globally
competitive Sorsogon City’s tourism promoting inclusive socio-economic growth for the wellbeing
of constituents and sustainable environment for the enrichment of culture and natural
heritage while addressing visitors’ needs and satisfaction.” The SCTDP also anchors on
competitiveness aligned and as part of sustainable tourism to monitor and evaluate its
performance and efficiency for its enhanced growth.
The Development Outcomes
The development outcomes are: (a) Increased tourism arrivals in Sorsogon City
from 86,658 in CY 2019 to 658,059 in CY 2025; (b) Increased in tourism receipts from
PhP 119,948,400 in CY 2019 to PhP 910,858,163 in CY 2025; (c) Jobs created from 7,878
in CY 2019 to 51,946 in CY 2025, and; (d) Improved safety, peace & order.
5.4 The Development Programs
The attainment of the desired outcomes will rely in the tourism development programs
with its respective strategic plan of actions which shall be implemented. These are the following:
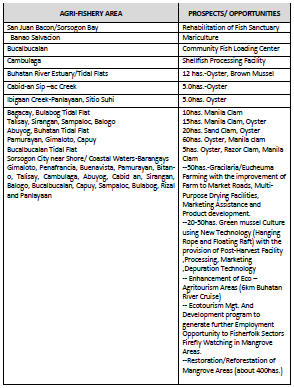
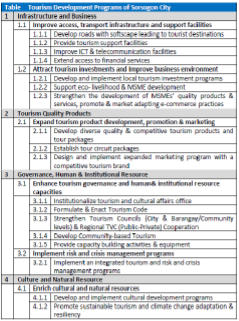
Table 9. Tourism Development Program
Resource generation and utilization (energy 2015)
- Sorsogon Electric Cooperative II supplies 7.54 megawatts of power to Sorsogon City
everyday - 31,840 households (92%) in Sorsogon city have access to electricity
- Gasoline 3.4 million liters is sold in Sorsogon city everyday
- Diesel 2.6 million liters sold everyday
- Approximately 3.8 million kg of LPG are sold annually
- Yearly consumption of a typical sorsoganon
- 15 liters diesel
- 20 liters gasoline
- 23 kg of LPG
- 4.24% of Sorsogon City’s total energy consumption is derived from renewable sources
Power
- Advocacy on the use of renewable energy (solar, hydro,
- Study on possible sites of wind power, E-cars/tricy
- Start government facilities with the use of renewable energy
- Initiate/Request of direct line from the geothermal plant (BACMAN)
- Identify areas for solar panel fields
- Increase the use of renewable energy by at least 30 percent
Water
Resource generation and utilization 2015 study
- 50% of the city’s barangays are serviced the water district
- 82% of the city’s population have access to potable water
- Every person in Sorsogon City consumes about 100 liters of water per day
- Water district currently draws water from the Cawayan River, 13 deep wells and four
springs. - 17 million liters of water is consumed by the city population per day
- 80% of water provided to households becomes wastewater
- 86% of the households have sanitary toilets
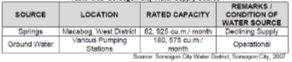
Domestic Water Supply
- The waterworks system run by Sorsogon City Water District (SCWD) supplies water to
the city. It is a Government-owned and controlled corporation created under the
Presidential Decree No. 198 (Provincial Water Utilities Act of 1979). The Sorsogon City
Water District - water system has 7,944 active connections in 2007 Its main sources of water comes
from springs located in Macabog, - West District and ground water located in various pumping stations as shown in
- The City or LGU-managed water system supplies the water requirement of the Bacon
Poblacion. CABANSAN Water System supplies - Barangays Cabarbuhan, San Roque, Balete, and San Isidro.
Table 10. Connection by Type of Users and Average Consumption
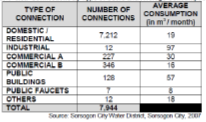
Table 11. Sorsogon City Water Supply Source
Communication Network
Radio Stations and Cable Television
There are 6 FM Radio stations providing local, national and international news in the city
of Sorsogon and 2 cable providers (DCTV and Cignal)
Internet Service Provider
- DCTV
- Globe
- Smart PLDT
- DITO
- Converge
Waste management
Garbage Disposal
The city is being served by two dumpsites at Brgy. Buenavista and Brgy. Baco n, located
at West District and Bacon District, respectively. The dumpsite in Brgy. Buenavista has an
area of 3.4 hectares and has a volume capacity of 204, 000 cubic meters. On the other
hand, the dumpsite in Brgy. Bato covers an area of 2.0 hectares with a 120, 000 cubic meter
capacity. Solid waste disposal is beings served by nine operational garbage trucks.
8.0 IMPLEMENTATION STRATEGY
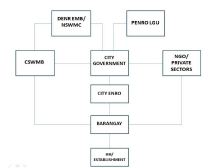
Figure 10. Framework
The Sorsogon City Solid Waste Management Framework follows the template provided
by the Act in which the barangays and the City Government shares the responsibility in the
handling and management of solid wastes: the former, in ensuring the implementation of waste
segregation, initial waste collection and recovery via MRFs within their respective areas of
jurisdiction, while the latter in providing efficient waste collection system for non-recyclable and
special wastes as well as its safe disposal in the City. This sharing of responsibility between LGUs
necessarily includes increasing the capacity of barangays to conduct initial waste collection and
recovery through provision of assistance by the City Government. Furthermore, it also includes
proper coordination between the City LGU and barangays in carrying out waste collection services
particularly in terms of mapping out collection routes and separate collection schedules for
different types of wastes, and designation of collection points to ensure the efficient collection of
wastes in the community. In order to ensure a sustainable and responsive SWM program in the
City, the City Solid Waste Management Board (CSWMB) is convened to prepare a 10 Year SWM
Plan which the City Government will enforce. The Board will conduct periodic review of the Plan
to ensure that waste reduction targets are achieved and proposed programs are duly
implemented.
The Framework also recognizes the important role of waste generators (i.e., households,
institutions, & establishments) in the effective implementation of SWM program. Under the
framework, waste generators are designated as initial managers of their wastes. They are
required to practice source reduction, waste segregation, and proper waste storage within their premises. To ensure compliance, the LGU will utilize available tools and instruments as provided
by law: imposition of waste collection fees, awarding of incentives, imposition of fines and
penalties, permitting systems, etc.
Concerned government agencies such as DENR EMB, NSWMC and PENRO LGU will be
supporting the City LGU primarily by providing technical assistance such as trainings and
workshops aimed to improve the capacity of City LGU to address SWM concerns and comply with
mandatory provisions of the Act. These agencies will also exercise supervision over the City SWM
implementation through the conduct of regular monitoring and assessment. Private sectors and
NGOs will have auxiliary roles, coordinating the LGU programs with the barangays and providing
logistical assistance as needed.
Shown below is the schematic diagram of the City SWM program:
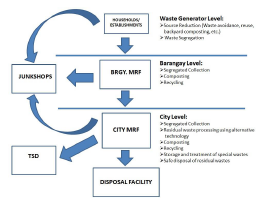
Figure 11. Diagram of the City SWM Program
The City SWM program has three levels corresponding to the three key players in solid
waste management: the waste generators, barangays, and the City Government. The primary goal
of the program is to reduce wastes as the level increases through the conduct of source reduction
and waste recovery activities. The program starts at the very moment wastes are created from
the various socio-economic activities at the waste generator level. The waste generator is
expected to exert efforts to control and limit as much as possible the generation of wastes. This
will be accomplished by practicing source reduction activities such as responsible utilization of
resources, reuse, and backyard composting. For the generated wastes, the generator has the duty
to segregate wastes and store them properly inside the premises as it awaits collection. Wastes
must be segregated according to the following classification: biodegradable, recyclable, nonrecyclable
(residual), and special wastes and must be brought out only during the scheduled time
of collection.
The next level is the barangay level in which the concerned barangay is expected to
conduct initial waste collection within its area of jurisdiction. To ensure that wastes are
segregated, the barangay will implement separate waste collection schedules for different types
of wastes. Mixed wastes will not be collected by the barangay in order to compel waste generators
to practice waste segregation while at the same time imposing penalties to those who practice
improper waste disposal.
Collected wastes will be brought in the barangay MRF to undergo further segregation and
processing. Biodegradable wastes will be composted while recyclable wastes will be stored
temporarily in the MRF to be sold later to junkshops. Residual wastes and special wastes will be
set aside for collection by the City.
The third and last level is the City level in which the City LGU collects residual and special
wastes from barangays. For barangays with no MRFs, particularly in the central business district,
the City Government will implement a separate schedule of collecting biodegradable wastes.
Collected wastes from the barangay will be brought in the City MRF to undergo another round of
segregation to sift all still-useful materials from the waste stream. Recyclable materials will be
stored in the MRF while biodegradable wastes will be processed and composted. Residual wastes
will be brought to the dumpsite for final disposal. Special wastes will be temporarily stored in the
MRF to be disposed by bulk by tapping the services of DENR-accredited Treatment, Storage, and
Disposal (TSD) Facility.
8.2 Diversion Projections
Shown in Table 8-1 the diversion projection of the City for the next ten years:
Table 12. Sorsogon City Diversion Projections (2018-2027)
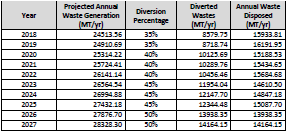
Diversion percentage adheres to waste reduction targets set by the NSWMC starting with
35% diversion in 2018. A 5% increment every 3 years is targeted to culminate at 50% by year 2026.
Since based on 2013 WACS, total recoverable wastes is 63.19%, the City LGU and barangays will
work together to recover as much biodegradable wastes and recyclables as possible. This will
entail the implementation of mandatory backyard composting provision of City SWM Ordinance,
“No Segregation, No Collection Policy,” full implementation of Anti-Plastic Ordinance, Earth
Savers Program, Search for Model Barangays and Schools, construction and operation of
additional barangay and District MRFs.
8.3 Monitoring Program
Table 13. Sorsogon City SWM Monitoring Plan (2018-2027)
8.4 Incentive Programs
In order to encourage wider participation of different sectors in the City SWM program,
various incentive schemes will be implemented by the City Government:
- Deduction in permit fees for accredited distributor of environmentally-acceptable
packaging; - Granting of financial capital to legitimate bayong cooperatives;
- Conduct of search contests for model schools and barangays in waste segregation and
processing; - Award of recognition to people, groups, or institutions with outstanding achievements in
solid waste management; - Provision of financial and logistical assistance by the City Government to barangays that
meet basic requirements such as having an approved barangay SWM Ordinance, an active
SWM committee, functional MRF, and willingness to put up counterpart for waste
management projects; - SWM enforcers to be entitled for a percentage from collected fines from violators of
City &barangay solid waste ordinances.
9.0 INSTITUTIONAL ASPECTS
9.1 Roles
Roles of key players in solid waste management were discussed in Chapter 8. As the City
makes headway in the implementation of its SWM program, increasing role of barangay in terms
of waste collection and the conduct waste recovery activities such as composting and recycling
will be expected. The City SWM Plan is designed with this in mind. The main objective is to make
waste collection and recovery a joint responsibility of the barangay and the City by year 2027. This
will be achieved by providing assistance to barangays. But as a rule, the City Government will only
provide assistance to barangays that meet the basic requirements of the Act such as having an
approved barangay SWM Ordinance, an active SWM committee, functional MRF, and lastly,
willingness to put up counterpart for waste management projects.
The City SWM Board will continue to monitor the implementation of the Plan, giving
special emphasis in determining whether waste reduction targets are being met or not. The Board
will also make the necessary adjustments and revisions of the Plan to accommodate changes in
the City brought by socio-economic development. As climate change and environmental issues
continue to permeate the consciousness of the people, Civil Society Organizations (CSOs) and
People’s Organizations (PO’s) from urban and agricultural sectors will become more active in environmental protection and will be working closely with the LGU. Thus, the Board is expected
to increase in membership with the addition of CSOs and POs.
National government agencies such as the DENR and NSWMC will continue to support
the LGU in the implementation of its SWM program through the provision of technical assistance
in the form of trainings, workshops, and technical advises. Said agencies will also continue to
monitor the progress of implementation of the Plan making the necessary recommendations in
order for the LGU to meet waste reduction targets. Private sectors and NGOs will continuously
assist the LGU in SWM implementation in an auxiliary capacity. The LGU will work closely with
these agencies tapping their expertise and resources in order to provide better waste
management services to the people. Junkshop operators in the City will be organized in order to
regulate the industry and coordinate effectively the recycling efforts of the LGUs. To ensure
cooperation among the key players, the LGU will make it as a rule that proper consultation be
conducted prior to implementation of any major projects or policies. Quarterly meeting of the
City SWM Board will be strictly observed in order to provide stakeholders with proper venue to
discuss SWM concerns and issues.
9.2 Legal
To ensure wider participation, the LGU will embark on strict enforcement of the City
Ordinance, imposing fines and penalties to violators. As part of the preparation, the LGU will train
and deputize enforcers who will apprehend violators of SWM Ordinance. As an incentive to
enforcers to be steadfast in their duty, a percentage from the collected fines will be awarded to
the apprehending enforcer. In the case of commercial and industrial establishments, the City
Government through its City ENRO will continue to exercise regulatory powers to monitor
compliance of establishments with the City SWM Ordinance. Non-compliance will result to nonissuance
of Certification or revocation of business permit. Repeated and grave offenders will be
endorsed to the City Legal Office for filing of case against them.
10.0 SOCIAL ANDENVIRONMENTAL ASPECTS
10.1 Social Aspects
The protection and promotion of the health and the right to a clean environment of its
constituency is the primary concern of the city and in order to achieve sustainable development,
environmental protection and social concerns shall constitute an integral part of the development
process and cannot be considered in isolation from it.
Implementation of community-based SWM Program has significant social impacts which
could make or break the program. It is important that the program will be acceptable to the
stakeholders. Thus, this would mean that the program will not cause adverse impacts to the
health and livelihood of the people but on the contrary will provide benefits. It is therefore
important that the major SWM projects of the City LGU must undergo public consultation with
stakeholders where the positive impacts of the project will be highlighted. If there are negative
impacts, these must be presented truthfully alongside with the LGU commitment to address the
identified impacts and its corresponding actions/measures to address the same.
Major SWM projects of the City include the operationalization of City Level MRF in Brgy.
Buhatan, City Level MRF in Sitio Sta. Teresita in Brgy. Bato, the closure and rehabilitation of
Buenavista and Bato Dumpsites, and establishment of Categorized Sanitary Landfill (Category II).
Although these projects are primarily aimed to upgrade the City SWM implementation since these
are large-scale needed infrastructure projects, it cannot be avoided that these projects will have
negative impacts to adjacent residents. To make these projects acceptable, public consultation
must be first conducted with host communities to determine their side. The City LGU in coordination with the host communities shall conducted a massive continuing information and
education campaign on environmental protection that will develop public awareness of the illeffects
and the community-based solutions in relation to these environmental projects of the city.
The City LGU must be open and transparent with regards to the extent and operation of
the project in order to gain the trust of the people. The challenge for the LGU is to convince the
host community that the projects positive impacts outweigh the negative. Furthermore, the City
LGU shall undertake continuing studies and researches on environmental management on these
projects with the end adopting modern and applicable systems and concepts and technologies
that may be adopted by the City purposely in the abatement of negative impacts of these projects.
Likewise, the LGU shall guarantee to its stakeholders that these projects are within the standards
set forth by national regulatory agencies and complied with the required pollution standards.
Hiring of personnel from host communities as part of the labor force during the project
construction and operation will also help make the project acceptable to the people. Prospects of
business opportunities from the City and Barangay MRF operation are other positive impacts that
must be highlighted and promoted. To minimize the odor from collected wastes garbage trucks
will be provided with appropriate covers and nets. In addition, the LGU shall establish and
maintain a monitoring system that will ensure the proper implementation and disposal in the City.
With the closure and rehabilitation of the two dumpsites, scavengers or waste pickers relying
their subsistence from recovered scraps in these dumpsites, will be displaced. During the preclosure
stage of the dumpsites activities that the LGU to the displaced waste pickers as part of its
social responsibility will conducting census among them and necessary livelihood assistance in the
form of providing capital for waste pickers to buy scraps and recyclable materials in the
community and other possible livelihood program that may be given to them. Another strategy is
to hire them as waste sorters in the City Level MRFs. These are parts of the DENR-EMB approved
Safe Closure and Rehabilitation Plans (SCRPs) for the City Dumpsites which is the provision of
livelihood program for the affected families.
10.2 Environmental Aspects
The City SWM program aims to address effectively the present City’s problem on solid
waste such as from generation, storage, collection and its disposal. As such the City SWM program
has become part of the City LGU’s flagship program. Solid Waste Management is anchored in the
city’s slogan “Mauswag na Ciudad, Malinig na Lugar” in which the LGU already started the
implementation of “No Segregation, No Collection Policy” in April 2016 covering ten (10) urban
barangays which make up the Central Business District (CBD). Alongside with this, it has already
operated the City Level Material Recovery Facility (MRF) in Barangay Buhatan to recover and
process waste collected from the CBD. To compliment this initiative the LGU partnered with the
Energy Development Corporation and provided logistical assistance to the barangay such as
pedicabs and pushcarts to capacitate them to become effective partners in the program. And as
part of our source reduction campaign the first and second phase implementation of the Sorsogon
City Anti-Plastic Ordinance (SCAPO) covering large and medium business establishment had
already started and will be pursued to cover all other establishments.
Furthermore, the City LGU implements and supervises garbage collection, transport and
disposal in the City. Likewise, it also control, supervise and develop garbage collection, transport
and disposal operations including its personnel, maintains equipment for collection and facilities
for disposal. It also establishes and maintains a monitoring system that will ensure the proper
implementation of the garbage collection and disposal in the city. In addition thereto, the
continuing conduct of special cleaning operations to complement the regular garbage collection
such as street sweeping and river ways clean-up. As such, regular conduct of IEC campaign on
proper solid waste management to all stakeholders in the city.
However, there are large scale infrastructure projects under the City SWM Program that
may have impacts to the environment. These projects include the operationalization of City Level
MRF in Brgy. Bato, the closure and rehabilitation of Buenavista and Bato Dumpsite and the
establishment of Categorized Sanitary Landfill (Category II) at Barangay Buenavista in this city. To
ensure the mitigation of the potential impacts to the environment, appropriate permits and documents must be secured prior embarking on full scale implementation of these projects. In
this case of the City MRF, said project was issued a Certificate of Non-Coverage (CNC-R05-0910-
0023) on October 08, 2008 and once the project starts its operation, Wastewater Discharge
Permit (WDP) will be secured from the EMB. For the closure of the Buenavista and Bato
Dumpsites, a Safe Closure and Rehabilitation Plans (SCRPs) for the two (2) dumpsites were already
approved by the DENR and the corresponding Authority to Close (ATC) was issued on December
08, 2008. For the proposed establishment of Categorized Sanitary Landfill (Category II) at
Barangay Buenavista, West District, Environmental Compliance Certificate will be secured from
the DENR-EMB and other regulatory permits.
11.0 COST ESTIMATES/ FINANCIAL ASPECTS
11.1 Investment Cost
Implementation of SWM program requires considerable financial resources on the part
of the LGU. This is because most of the interventions to address deficiencies in waste
management are both labor and resource intensive. Aside from large number of personnel,
support facilities and equipment are needed to be able to carry out basic services such as waste
collection, recovery, and disposal. Below is the investment cost of the LGU in the next ten years,
divided into physical development and equipment.
Table 14.Capital Outlay (Physical Development and Structures)
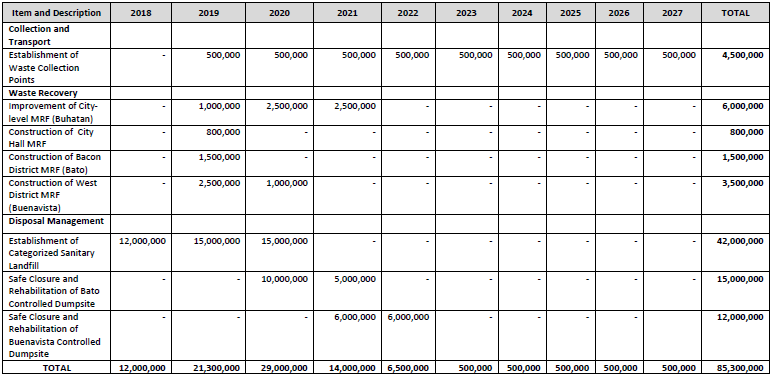
As shown, projected cost in terms of physical development and structures amounts to Eighty
Five Million Three Hundred Thousand Pesos (Php 85,300,000.00). The period between 2018-2022 is
marked by high costs since it is at this time that the City Government will be undertaking the
implementation of its major physical development projects such as the Categorized Sanitary Landfill,
District MRFs in Bacon and West Districts, and the Closure and Rehabilitation of Buenavista and Bato
Controlled Dumpsites. After 2022, cost will significantly go down as there will be no more major
infrastructure to be established. The remaining physical development cost after 2022 will be mainly
on waste collection points in barangays as part of the effort to promote segregated collection of
biodegradable and non-biodegradable wastes at the barangay level.
Table 15. Capital Outlay (Equipment and Vehicles)
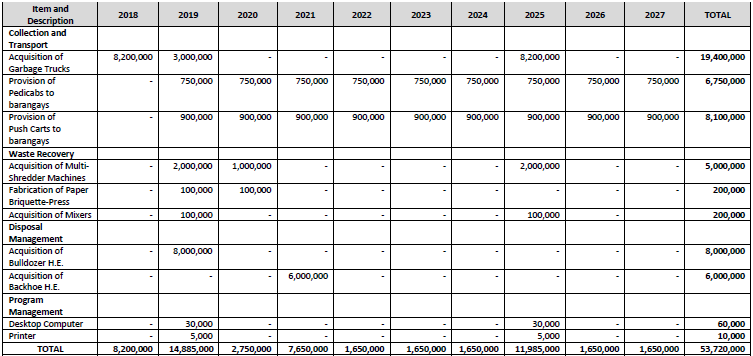
Projected cost on equipment and vehicles for the next ten years is Fifty Three Million
Seven Hundred Twenty Thousand Pesos (Php 53,720,000.00). Majority of the cost will be
spent on new garbage trucks and acquisition of heavy equipment such as back hoe and
bulldozer. Most of these vehicles and equipment will be procured in 2018-2019 period during
which the City LGU is expected to be in the process of establishing its Categorized Sanitary
Landfill. Additional procurement of vehicles will be made in 2025 to replace old units which at
this time are expected to be unserviceable. Considerable investments will be made on brand
new garbage trucks to ensure efficient and reliable garbage collection program well beyond
the 10-year scope of this Plan. Moreover, provisions for office equipment such as computer
and printer are also made to ensure that staff will have the means to record, store, and
process information regarding the SWM program of the City Government.
On the other hand, provision of pedicabs and push carts to barangays will be sustained
throughout the ten-year period as part of the effort to increase the capabilities of barangays
in conducting segregated collection within their respective areas. Adequate waste processing
machineries such as shredders, briquette presses, and mixers will also be procured to bolster
the waste recovery operations in the City-level MRF and District MRFs.
11.2 Annual Cost
Annual cost involves expenses incurred in the implementation of solid waste
management. It covers expenses in the maintenance and operation of waste management
facilities such as the City MRF and Dumpsites, fuel and repair of vehicles, and salary of
personnel. Total projected cost for Maintenance, Operating, and Other Expenses (MOOE) for
the next ten years is Eighty Three Million Nine Hundred Thirty Thousand Pesos (Php
83,930,000.00) as shown in Table 11-3:
Table 16. Maintenance and Other Operating Expenses
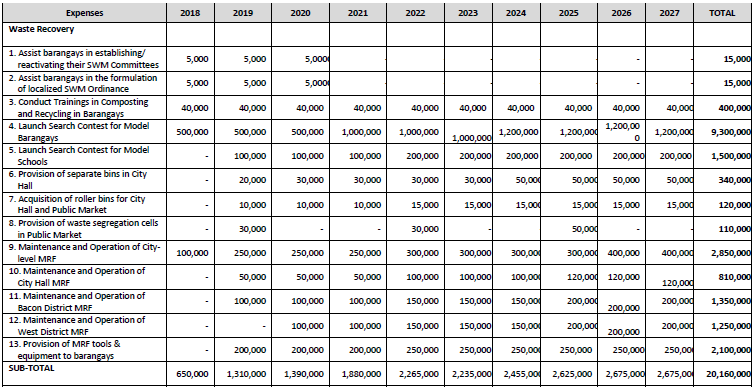
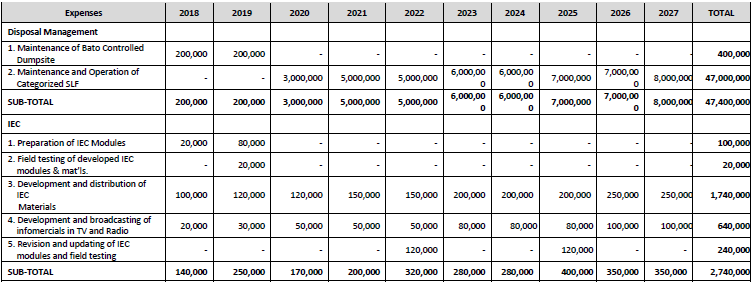
Table 17. Maintenance and Other Operating Expenses (cont.)
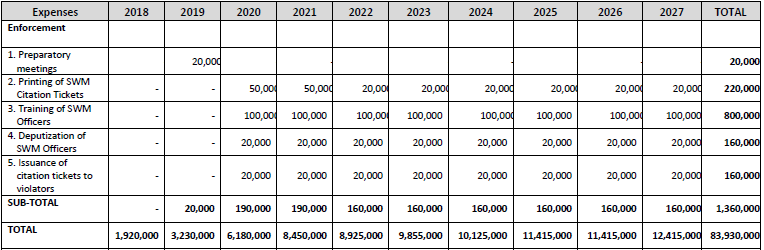
For the projected cost of labor, Table 11-4 shows the breakdown of expenses for SWM personnel within the next ten years amounting to Two
Hundred Seventy-Seven Million Nine Hundred Thirty Six Thousand (Php 277,936,000.00). A steady increase in labor cost will be observed peaking in 2026
at Php 32,244,000.00 with the bulk of the cost to be devoted to Collection and Transport, particularly for Street Cleaners, Eco-Aides, and Garbage Collectors.
Table 18. Personnel Expenses
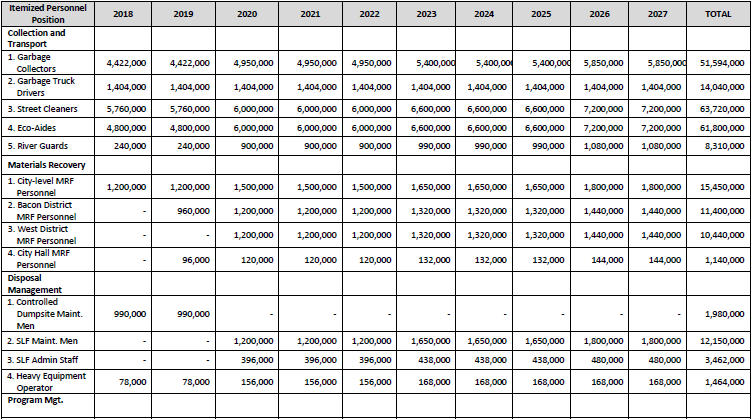
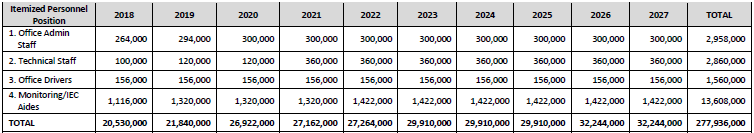
Total cost of SWM activities and projects for the period 2018-2027 is Five Hundred Million Eight Hundred Eighty-Six Thousand Pesos (Php
500,886,000.00). More than half of which is to be devoted to Personnel Expenses (55.49%) while the other half is to be divided between Capital Outlay and
MOOE. The first five years of the plan (2018-2022) will be marked by massive spending in terms of Physical Development and Structures as well as Equipment
and Vehicles since it is at this period that major projects will be implemented such as establishment and operation of SLF, closure and rehabilitation of Bato
and Buenavista Dumpsites, establishment and operation of Bacon and West Districts MRFs, and procurement of new garbage trucks and heavy equipment.
In the case of MOOE and Personnel Expenses, steady increase in their annual allocation will be observed throughout the ten-year period culminating in 2027
at Php 12,415,000.00 and Php 32,244,000.00, respectively.
Below is the annual breakdown of expenses based on Cost Items:
Table 19. Total Projected SWM Cost of Sorsogon City, 2018-2027
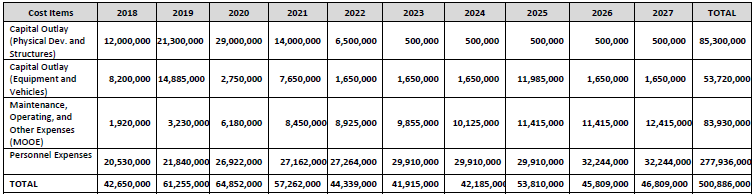
11.3 Funding Options
In order to realize the programs and projects stated in the 10-year Solid Waste Management Plan, the City LGU needs to allocate more funds for
waste management. For the past 9 years, allocation for SWM varies from 3-5% of the total annual budget of the City LGU (See Table 3-8).
The LGU must increase the SWM allocation for up to 6-8% of the annual LGU budget in the next five years (starting in 2019), in order to meet the
intensive financial requirements of the SWM program. Point offices such as City ENRO and SWM Office must convince the administration as well as the
Sangguniang Panglunsod on the need to allocate adequate funds to finance the different programs and projects stated in this Plan. Aside from this, the City
LGU must exert efforts to maximize the collection of revenues from garbage collection fees on business establishments, certification fees, sale of recyclable
materials and organic fertilizers in the City MRF, as well as fines and penalties imposed on violators of SWM Ordinance. The City LGU, with adequate public
consultation must also consider the idea of charging residents and institutions with garbage fees in order to boost SWM revenues based on Sec. 47 of RA
9003 and “polluters must pay” principle. The latter would mean that the garbage fees that will be imposed on residents and institutions will be based on the
volume of wastes that they brought outside their premises for collection. Thus, the more wastes that they throw, the higher the amount that they will have
to pay to the government, and vice versa.
By introducing the concept of “price” in SWM program, it achieves two vital objectives: revenue generation and waste reduction. Fees collected shall
accrue either to barangay or City LGU whichever that conducts the garbage collection service in a particular area. At the same time, the people will be
compelled to adopt methods and practices that will reduce their daily wastes such as waste segregation, composting, reuse, recycling, etc.
In case that said fiscal measures still fall short, the City LGU could resort to alternative options such as borrowing funds from financial institutions or
marketing this SWM Plan to government and private funding institutions for private-public partnership, joint venture, or similar undertakings particularly for
large physical infrastructure projects such as the Sanitary Landfill, Closure and Rehabilitation of Controlled Dumpsites in Bato and Buenavista, and District
MRFs. In the event that the City Government would opt to pursue these options, efforts will be made to ensure that all needed pre-requisites and documentary
requirements will be prepared and that all steps that will be undertaken will be compliant to existing rules and regulations. Below is the projected SWM
revenue of the LGU for the next 10 years:
Table 20. SWM Revenue Projections (2018-2027)
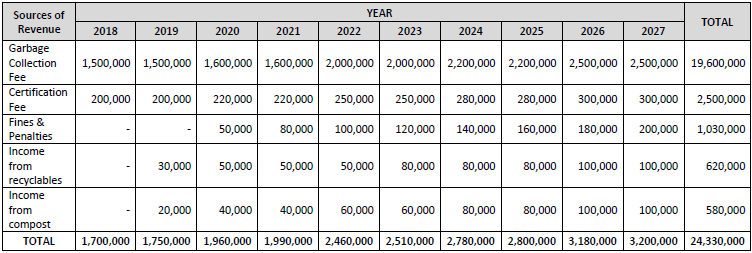
As can be seen in the above table, SWM Revenue Projections in the next 10 years will be marked by steady increase with majority of revenues
coming from garbage collection fees from business establishments. Excluded in Table 11-6 are the projected revenues from garbage fees from residents
and institutions as said measure still have issues that need to be ironed out like the schedule of fees, the sharing scheme between the City and barangays,
arrangements in the collection of fees, etc. In addition, intensive public consultation and passage of appropriate ordinance must be done in order to
implement this measure.
11.4 Cost Evaluation and Comparison
The stated Programs, Projects, and Activities (PPAs) in the SWM Plan require extensive
financial resources. One way of looking at it is to see the cost in relation to the population of
the City. This will show the per capita investments of the City Government on SWM Program
and its different components. Shown in Table 11-7 the SWM Cost per Capita throughout the
10-year planning period:
Table 21. Annual SWM Cost per Capita (2018-2027)
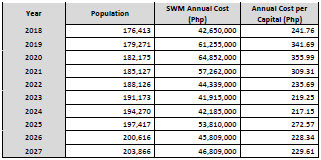
Annual Cost per Capita within the 10-year period ranges from Php 217.15 to Php
355.99 per person per year. This means that on the average, the City Government will be
investing an amount of Php 265.14 per person per year or Php 0.7264 per person per day for
SWM program. The variation in values of the Cost Per Capita reflects the developmental
activities and projects to be implemented within the 10-year planning period. As can be seen
in Table 11-7, the highest values could be observed during the first 5 years of the Plan (2018-
22) which will be marked by intensive physical development projects and investments for
equipment and vehicles. This will be followed by a 2-year decrease during the second half
(2023-24) in which the City Government will be basically maintaining and operating the
different SWM facilities established earlier. Annual Cost per Capita will eventually surge in the
last 3 years (2025-27) which could be attributed to acquisition of new garbage vehicles and
equipment to replace the remaining old units.
As for breakdown of SWM cost for the 10-year period, shown below is the Annual Cost per
SWM Component:
Table 22. Annual Cost per SWM Component (2018-2027)
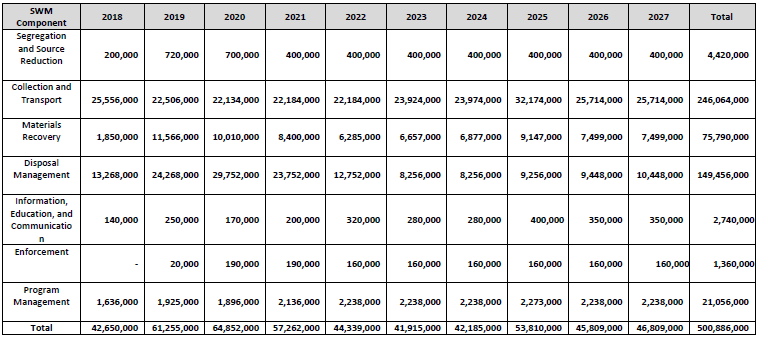
As can be seen in the Table above, almost half of the total cost for SWM Program is
attributed to Collection and Transport (49.13%), followed by Disposal Management (29.84%),
Materials Recovery (15.13%), Program Management (4.20%), Segregation and Source
Reduction (0.88%), IEC (0.55%), and Enforcement (0.27%). Majority of the cost for Collection
and Transport will be used to defray the wages of garbage collectors, garbage truck drivers,
street cleaners, eco-aides, and river guards while the rest is assigned for procurement of
collection vehicles such as garbage trucks, pedicabs, and push carts and PPEs for workers. This
trend is not surprising since garbage collection is usually considered as the most resource
intensive of all SWM components due to its large logistical requirements. As for Disposal
Management, the bulk of the cost is due to the establishment of Sanitary Landfill and closure
& rehabilitation of Bato and Buenavista Controlled Dumpsites. In the case of Materials
Recovery, the establishment of District MRFs in Bacon and West Districts and hiring of
personnel make up its total cost. For Program Management, cost is mainly due to the hiring
of support personnel including office administrative staff, technical staff, and monitoring/IEC
personnel as well as procurement of computers and printers. Lastly for Segregation and
Source Reduction, IEC, and Enforcement, cost is due to training workshops, information
materials, and other required logistics.
11. 5 Summary
Below is the summary of SWM cost and projected revenues for the period 2018-2027:
Table 23. Comparison of Projected Cost and Revenues
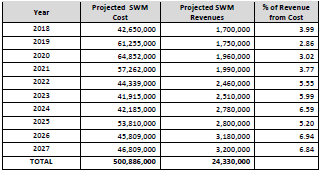
As can be observed, projected revenue constitutes a small fraction only of the SWM
cost, ranging from 2.86 to 6.94% (average 5.08%). This means that the City LGU cannot entirely
depend on projected SWM revenues to meet the financial requirements of the SWM program
and must continuously subsidize these programs. The City LGU must look for alternative
sources of funds aside from IRA and local revenues in the next couple of years in order to
bridge the wide gap in financial resources. The LGU must lobby with National Government Agencies and even the private sector to fund the activities in the Plan. Cash incentives from
National Government Agencies through their programs could be tapped to finance SWM
PPAs. One example of this is the Seal of Good Local Governance (SGLG) of the Department of
Interior and Local Government in which the City Government has been a recipient in 2016 and
2017 enabling it to access Performance Challenge Fund (PCF). In addition, the City LGU may
consider establishing partnership with local and international funding agencies or applying
financial loans from banks. In this way, the LGU will be able to have sufficient funds to
implement the programs and projects in the SWM plan.
12.0 PLAN IMPLEMENTATION
12.1 Phases and Responsibilities
The City 10-Year Solid Waste Management Plan (2018-2027) provides the general
direction in addressing the city’s manifold issues and concerns on waste management as well
as achieving prescribed diversion targets. It is an updated version of an earlier plan adopted
in 2013 that was given conditional approval by the NSWMC in April 2015. Specifically, this Plan
contains needed Projects, Programs, and Activities (PPAs) that the City Government will
implement within the next 10 years, the corresponding financial requirements, time frame,
and the responsible agency/office. Having been prepared by multi-sectoral City Solid Waste
Management Board and its Technical Working Group within a 6-month period, the Plan is
intended to integrate the different concerns of various sectors in the community to ensure
that it will be more responsive and holistic. The Plan recognizes the expertise of different
agencies within and outside the City Government, and allows projects and programs falling
within the expertise of a particular agency to be implemented by the same agency subject to
review by the Board.
Thus, implementation of solid waste management-related projects will be headed by
City ENRO/City SWMO in the city-level and by concerned barangay council at the barangaylevel,
physical infrastructures will be led by City Engineering Office, information dissemination
particularly in the development of modules to be led by DepEd, provision of livelihood
trainings and assistance by Department of Trade and Industry and City Social Welfare and
Development Office (CSWDO), etc. In this way, PPAs stated in the Plan will be properly
implemented by the most qualified/capable agency while ensuring wider participation of
different sectors and sharing of accountability. The City SWM Board will be the main body to
conduct periodic review and evaluation of the Plan. Table 5-2 enumerates the responsibilities
of the Board as well as other agencies pertaining to SWM Plan implementation.
12.2 Milestones
By year 2027, it is expected that Sorsogon City will be able to institutionalize an effective,
Barangay-based Solid Waste Management Program effectively addressing major issues in
waste management particularly in waste segregation, collection, processing, and disposal with
the following milestones:
- Full implementation of Sorsogon City Anti-Plastic Ordinance by 2018;
- Acquire 4 units Garbage Truck by 2019, additional 3 units by 2025;
- Acquire 1 unit Bulldozer by 2019, 1 unit Backhoe by 2021;
- IEC modules prepared by 2019;
- Construction of new City Hall MRF in 2019;
- Construction of Bacon District MRF in 2019, West District MRF in 2020;
- Sustainable economic program for makers of traditional packaging (i.e., bayong) by
2020; - All barangays with SWM Committees and localized SWM ordinance/resolution by
2020; - Acquire 3 units Multi-Shredder Machine by 2020, additional 2 units by 2025;
- Establishment of Category 2 Sanitary Landfill by 2020;
- Enforcement of SWM Ordinance by 2020;
- Safe Closure and Rehabilitation of Bato Controlled Dumpsite by 2021;
- Safe Closure and Rehabilitation of Buenavista Controlled Dumpsite by 2022;
- Full implementation of “No Segregation, No Collection” Policy by 2022;
- Achieve 40% waste diversion by 2020, 50% diversion by 2027.
12.3 Implementation Schedule
City ENRO and CSWMO are the two main offices in charge with the implementation of
most of programs and projects in this Plan. Identified PPAs are mostly intended to capacitate
barangays to be able to address their particular waste management concerns. Barangays, in
turn, are expected to lead the implementation of SWM program in their respective areas of
jurisdiction particularly in the conducting segregated collection of biodegradable and nonbiodegradable
wastes, establishment and maintenance of Waste Collection Points (WCPs) or
Materials Recovery Facilities (MRFs), IEC, and maintenance of general cleanliness. For
activities that require specialized and technical skills such as implementation of physical
development/infrastructure projects or livelihood trainings, these are delegated to concerned
agencies such as the City Engineering Office, DTI, etc.
Table 24. In summary, shown below are the city diversion targets and
quantities within the period 2018-2027:
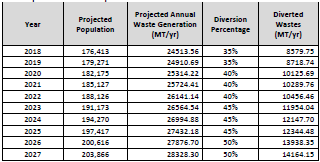
Table 25. City Waste Diversion Targets (2018-2027)
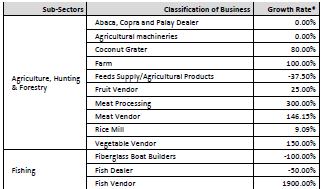
Structure of the Local Economy
The local economy of the City of Sorsogon may be described by tacking the three (3)
statuses of the sectors: Primary, Seconda ry, and Tertiary. Relative to the number of businesses
engaged in the three sectors, based on 2010 data, 73% of the business population belongs to
the tertiary sector, followed by the primary sector at 25%, and secondary sector at 2%.
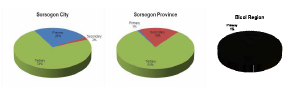
Figure 12. Structure of Local Economy
Source: Permits and Licenses Section, City of Sorsogon, 2010 and Philippine Statistical Agency
2012 for Bicol and Sorsogon Province.
Development Constraints
The areas suitable for development is the total area of the city less the areas with
development constraints. This results to 9,710.12 hectares suitable for urban development.
This include the existing urban areas of more or less 3,000 hectares. The inland waters and
buffer areas are part of the development constraints.
Protection Areas
- NIPAS protected areas and set aside for strict protection and conservation
- Geothermal Reservation Area
- Buffer zone of protected areas for production forest use
- Lands that are Forest and Forestlands in classification allocated as
production and protection areas - Riparian buffer zones in rivers, creeks, and lakes
- Salvage zones along coastal areas
- Prime agricultural lands planted to rice crop set aside for protection for food
security and rice sufficiency - Lands with slopes greater than 50%
Climate Change and Disaster Risk Areas
- High risk areas to flooding
- High risk areas to sea level rise
- High risk areas to tsunami
- High risk areas to ground settlement and subsidence
- High risk areas to storm surge
Development Challenges
- High cost of electricity
- Occurrence of typhoons, heavy (monsoon) rains
- Insurgency in selected areas
- Shift of livelihood of agricultural workers
- Low production and income
- Low income from tourism industry
- Not operational cold storage facility
- Lack of water for irrigation during dry season
- Low access to IT and lack of infrastructure
- Presence of informal settlements in vulnerable areas
- Lacks schools and health facilities in last mile/GIDA areas
- Inadequate evacuation centers
- Inadequate parks and open spaces
- Very poor presence of greenbelt areas and adoption of green technologies
Priority Issues and Concerns
- Physical Environment – improvement of space allocation for urban
expansion and park system, - Social sector
- Education – identification of expansion areas for central schools and
high schools at barangays which includes facilities - Health – land identification for new and expansion of health
facilities. - Housing identification and acquisition of lands for social housing,
- Social welfare services
- Protective services
- Sports and recreation
- Education – identification of expansion areas for central schools and
- Economic Sector
- Agriculture – identification of irrigation for irrigable rice lands,
identification of irrigable site to compensate classified and
developed Riceland in the urban areas and suitable development
areas with parcels of Riceland. - Commerce and Trades
- Industrial – identification of agro-industrial areas to cater to the
needs of the city’s role - Tourism – preservation of natural tourist attractions, identification
of new sites for tourism
- Agriculture – identification of irrigation for irrigable rice lands,
- Infrastructure
- Transportation – the improvement of roads and bridges, need for
widening and identification of new routes, improvement of roads
leading to residential areas, improvement of terminals including
watercraft, improvement of ports, improvement of existing Bacon
airport (economic viability) - Water – the improvement of existing water system in the urban
areas and barangays, identification of new water sources, and
identification of new technologies for cheaper processing to potable
water - Power – improvement of existing power supply, identification of
new technologies for cheaper power supply, coping up with demand
for power brought by urbanization - Communication – improvement of communication system and
internet facilities both in urban and rural barangays
- Transportation – the improvement of roads and bridges, need for
- Climate Change and Disaster Risk Reduction Management – identification
and implementation of adaptation and mitigation measures to reduce
effects of impacts of climate change and reduce disaster.- Increased in precipitation
- Increase in temperature
Comparative advantage
- Sub-regional center
- Center of commerce and trade of the province
- Educational center of the province
- Administrative center of the province
- Tourism hub of the province
Opportunities
- Presence of tourism facilities, hotels and restaurants, convention center
- Opens to both Sorsogon Bay and Albay Gulf
- Pili production
- BACMAN
- Presence of air strip
- Biggest IRA in Bicol cities?
Development opportunities
- Production of elemi oil from pili
- Cold storage in place for operation
- Urban and Rural Poor Office to implement social housing for the poor to
address tenurial insecurity, income poverty, disempowerment and
education poverty. With available financial resources from foreign
financial institutions and an organized urban poor in the city, the
implementation of this program is very timely.
- Sub-regional center, with Legazpi and Naga as regional centers
- Center of commerce and trade of the province
- Educational center of the province
- Administrative center of the province
- Tourism hub of the province
- Geothermal energy producing LGU
Functional Role of the City
As defined in the Regional Development Plan, Sorsogon City is categorized as a sub-regional
center with Naga and Legazpi as Bicol’s regional centers.
Being the capital town/city of the Province of Sorsogon, Sorsogon City serves as the
administrative, commercial, educational center of the province.
As a tourism hub, Sorsogon City serves as jump off point to the local attractions in the
province.
Based on the comparative summary of hazards affecting the province, Sorsogon City has will
not be affected by volcanic hazard (Bulusan Volcano) together with Matnog, Magallanes,
Castilla, Pilar and Donsol and other municipalities. In case of extreme evacuation due to
vulcanic eruption, Sorsogon City may act as Evacuation Center considering proximity,
availability of facilities and utilities, and
Harmony with provincial and Regional Plans
On the Provincial Plan
Sorsogon province envisions to be a province where prosperous, where people are
prosperous, resilient, healthy and living in a high-trust society. Sorsogon City likewise
envisions to be a model city in climate change and disaster risk resiliency with a contented,
empowered and values-oriented society that pursues socio-economic development within
the limit of nature thru genuine commitment to good governance.
The same focuses on resiliency and good governance or a high trust society in its
development policies. Other consistency of the city’s plan with the provincial plan are
stipulated and in accordance with the mission on protecting the environment through
sustainable development. Social services are both on quality services and socio economic
development pursued.
On the Regional Plan
The Bicol Regional Development Plan adopted the Ambisyon 2040 of the national
government to shall aspire to contribute to the attainment of a “Matatag, Maginhawa, at
Panatag na Buhay para sa Lahat” by laying down a solid foundation for more inclusive
growth, a high-trust and resilient society, and a globally competitive knowledge economy.
This will be done by focusing on three pillars of: “Malasakit” (enhancing the social fabric),
“Pagbabago” (reducing inequality), and “Patuloy na Pag-unlad” (increasing potential growth
of the economy). In connection with this, the city’s vision is also anchored on Ambisyon 2040
in terms of contented citizenry and socio-economic development.
Most of the built-up areas and existing development are situated along the coastal
areas. These are found to be at very high-risk areas to storm surge, flooding, and tsunami. For
the Coastal/ Built-Up/ High-Risk policy zone, the development strategy is Disaster Risk
Sensitive Redevelopment. Development of such areas will have to consider disaster risk
reduction as its primary objective.
The development strategy for the Inland/ Agricultural/ Low-Risk policy zone is maximizing
agriculture and expansion areas of the urban center.
Agri Optimization and Planned Urban Expansion
Upland/ Agri-Forest/ Medium Risk
Limited Agro-Forestry and Eco Tourism Development
Upland/ Protected Forest/ High Risk
Conservation/ No-Build Zone
Minimize disaster impact to people
Zero casualty
Fast recovery
Minimize damage to physical development
Protect existing development
Locate future development in safer areas
Encourage mitigation and adaptation measures for those in high risk areas
Protect prime agricultural lands
Protect and enhance environmental assets
Coastal
Disaster risk sensitive redevelopment
Minimizing damage
Protection of existing assets
Assistance to vulnerable communities
Preserving and protecting natural environment
Preventing further development in very high risk areas
Inland
Agri Optimization and Planned Urban Expansion
Preservation of prime agricultural areas
Identification of urban expansion sites
Development of infrastructure in urban expansion sites
Waterways protection and wastewater management to protect downstream areas from
flooding and pollution
Explore possibility of floodwater retention areas
Upland
Limited Agro-Forestry and Eco Tourism Development
Agro-forestry (coconut, abaca, fruit trees)
Passive recreation (hiking, camping)
Watershed protection and management
Potential for leisure farms
Slope stabilization for existing critical government facilities (short-term)
Upland
Conservation/ No-Build Zone
Forest protection/ conservation
Slope protection
Reforestation
Limited tourism/ passive recreation
Springs/ headwater protection
Coordination with PNOC EDC in terms of management of resources and promotion of ecotourism
activities
- Policy Zones
- High Risk/Coastal/Built-up Areas
- No higher
- High Risk/Coastal/Built-up Areas
Policy Zones
The policy zones were developed after the vulnerability assessment which identified
policies to which development shall be based and common to the area. For existing
developments which are situated in the high risk areas, relocations, disaster resiliency
application, such as mitigating structures shall be considered.
Inland low risk areas are proposed as urban expansion. Urban/detailed site planning is
recommended. Since these are mostly agricultural but non-irrigated, most favorable crops
for the areas for agriculture are recommended.
Eco-tourism development is recommended for uplands in medium risk. These are the not
so steep slopes for backpackers and nature enthusiasts. Agro forestry is recommended for
these areas.
For high risk areas which are situated on the upland areas with steep slopes will remain as
protected forest. No development is recommended. However, with the area reserved for
geothermal exploration (currently with geothermal plants), the existing policy is still with
the national government responsibility.
In summary, the development for these policy areas are:
- Coastal/ Built-Up/ High-Risk
- Disaster Risk Sensitive Redevelopment
- Inland/ Agricultural/ Low-Risk
- Agri Optimization and Planned Urban Expansion
- Upland/ Agri-Forest/ medium risk
- Limited Agro-Forestry and Eco Tourism Development
- Upland/ Protected Forest/ High Risk
- Conservation/ No-Build Zone
The objectives on disaster risk reduction will be adopted in the development objectives in this
plan. The following policies shall prevail:
- Minimize disaster impact to people
- Zero casualty
- Fast recovery
- Minimize damage to physical development
- Protect existing development
- Locate future development in safer areas
- Encourage mitigation and adaptation measures for those in high risk areas
- Protect prime agricultural lands
- Protect and enhance environmental assets
Figure 13. Policy Zone Map
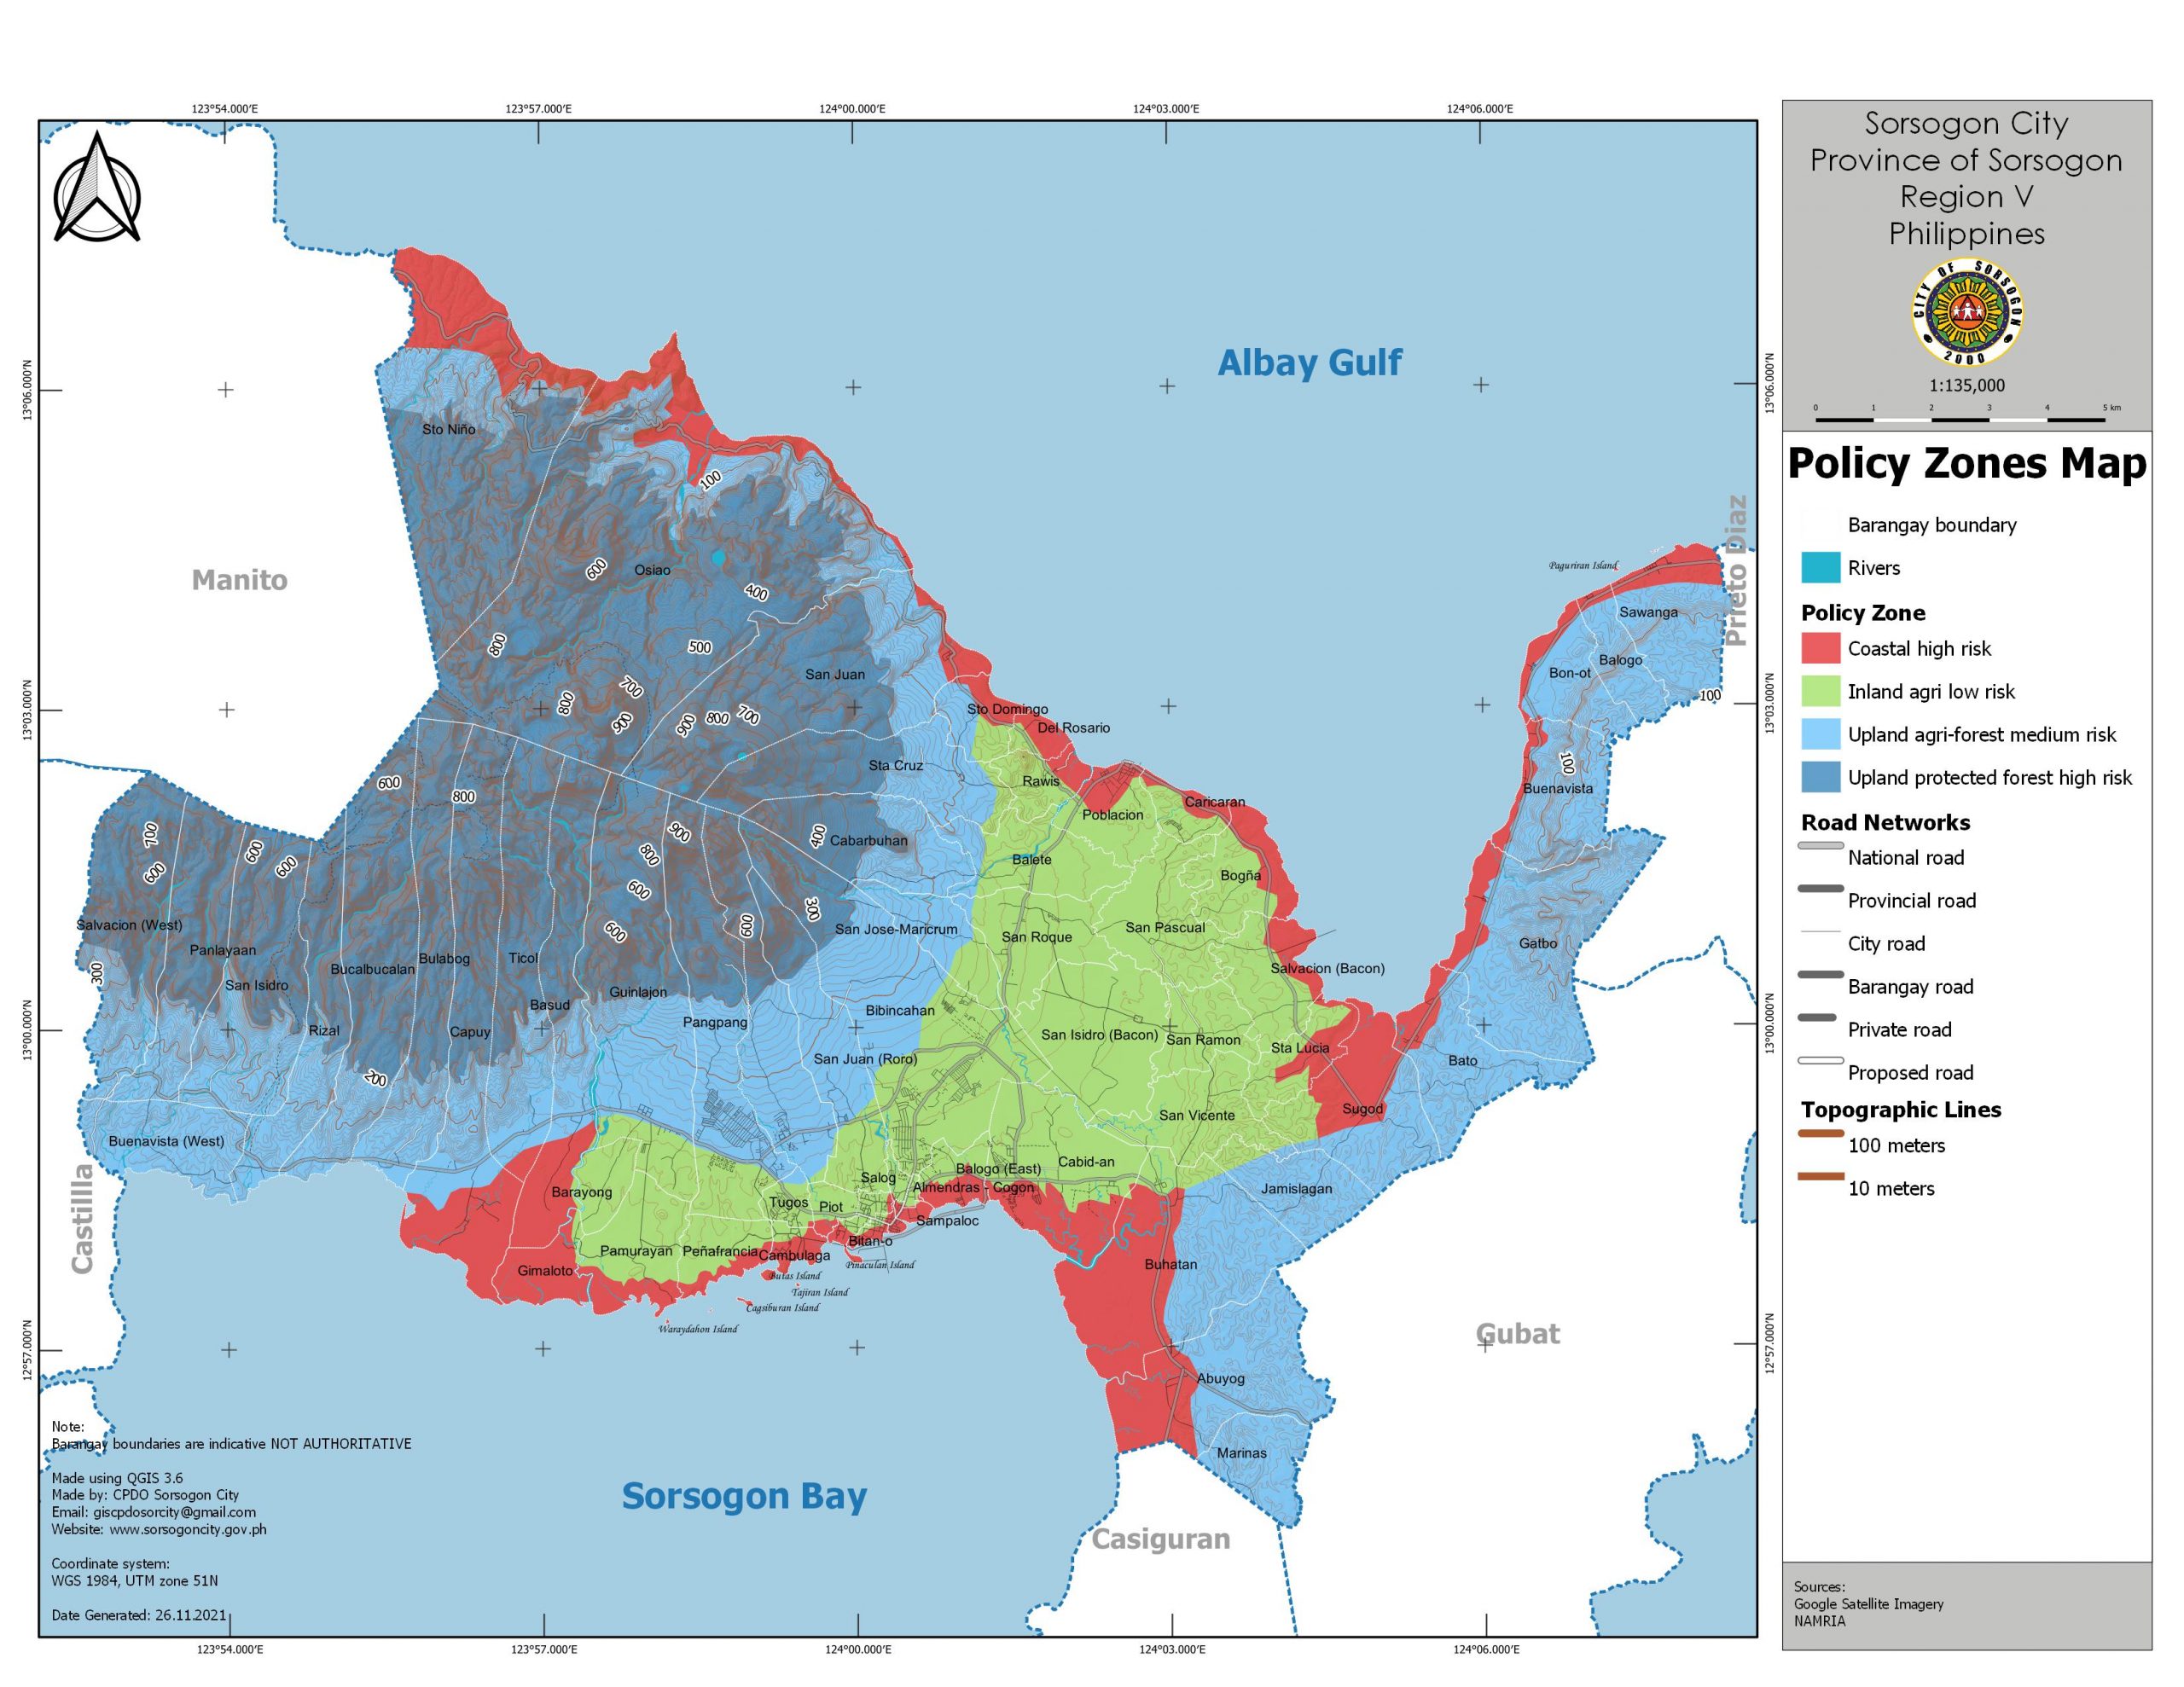
Table 26. Policy Zone
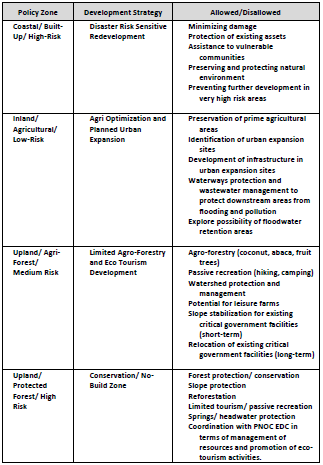
The available land for development is more than 9,000 hectares. Less than ten of the
total land area of the city is existing built-up areas. The challenge for the city is to maximize
the utilization of land based on its need for the planning period.
Agricultural areas within the urban barangays will be prioritized for the area needed
as urban expansion. Where small /pockets of Riceland are affected, policies include the
irrigation of identified irrigable areas to compensate the areas affected by the pressure of
urbanization.
Compact development. The concept is recommended to reduce cost of infrastructure
needed. This can be done through in-filling of vacancies or underutilized urban areas.
Perimeters adjacent to existing development is also recommended with conforming use as
the existing ones.
Planned Unit Development. Same as the satellite city (location of the city all and
housing) when it was conceptualized, the planned unit is a mixture of land uses with
commercial, residential, institutional areas in a unit development. Although revisions to the
plan were made based on administrations priorities. The commercial portion (on the
government lot) was scrapped. Commercial establishment grew on the adjacent lots.
Deferred development. Areas identified as urban expansion but to maximize its use,
shall be deferred for the next half/third/quarter of the planning period.
Figure 14. Structure/Concept Map
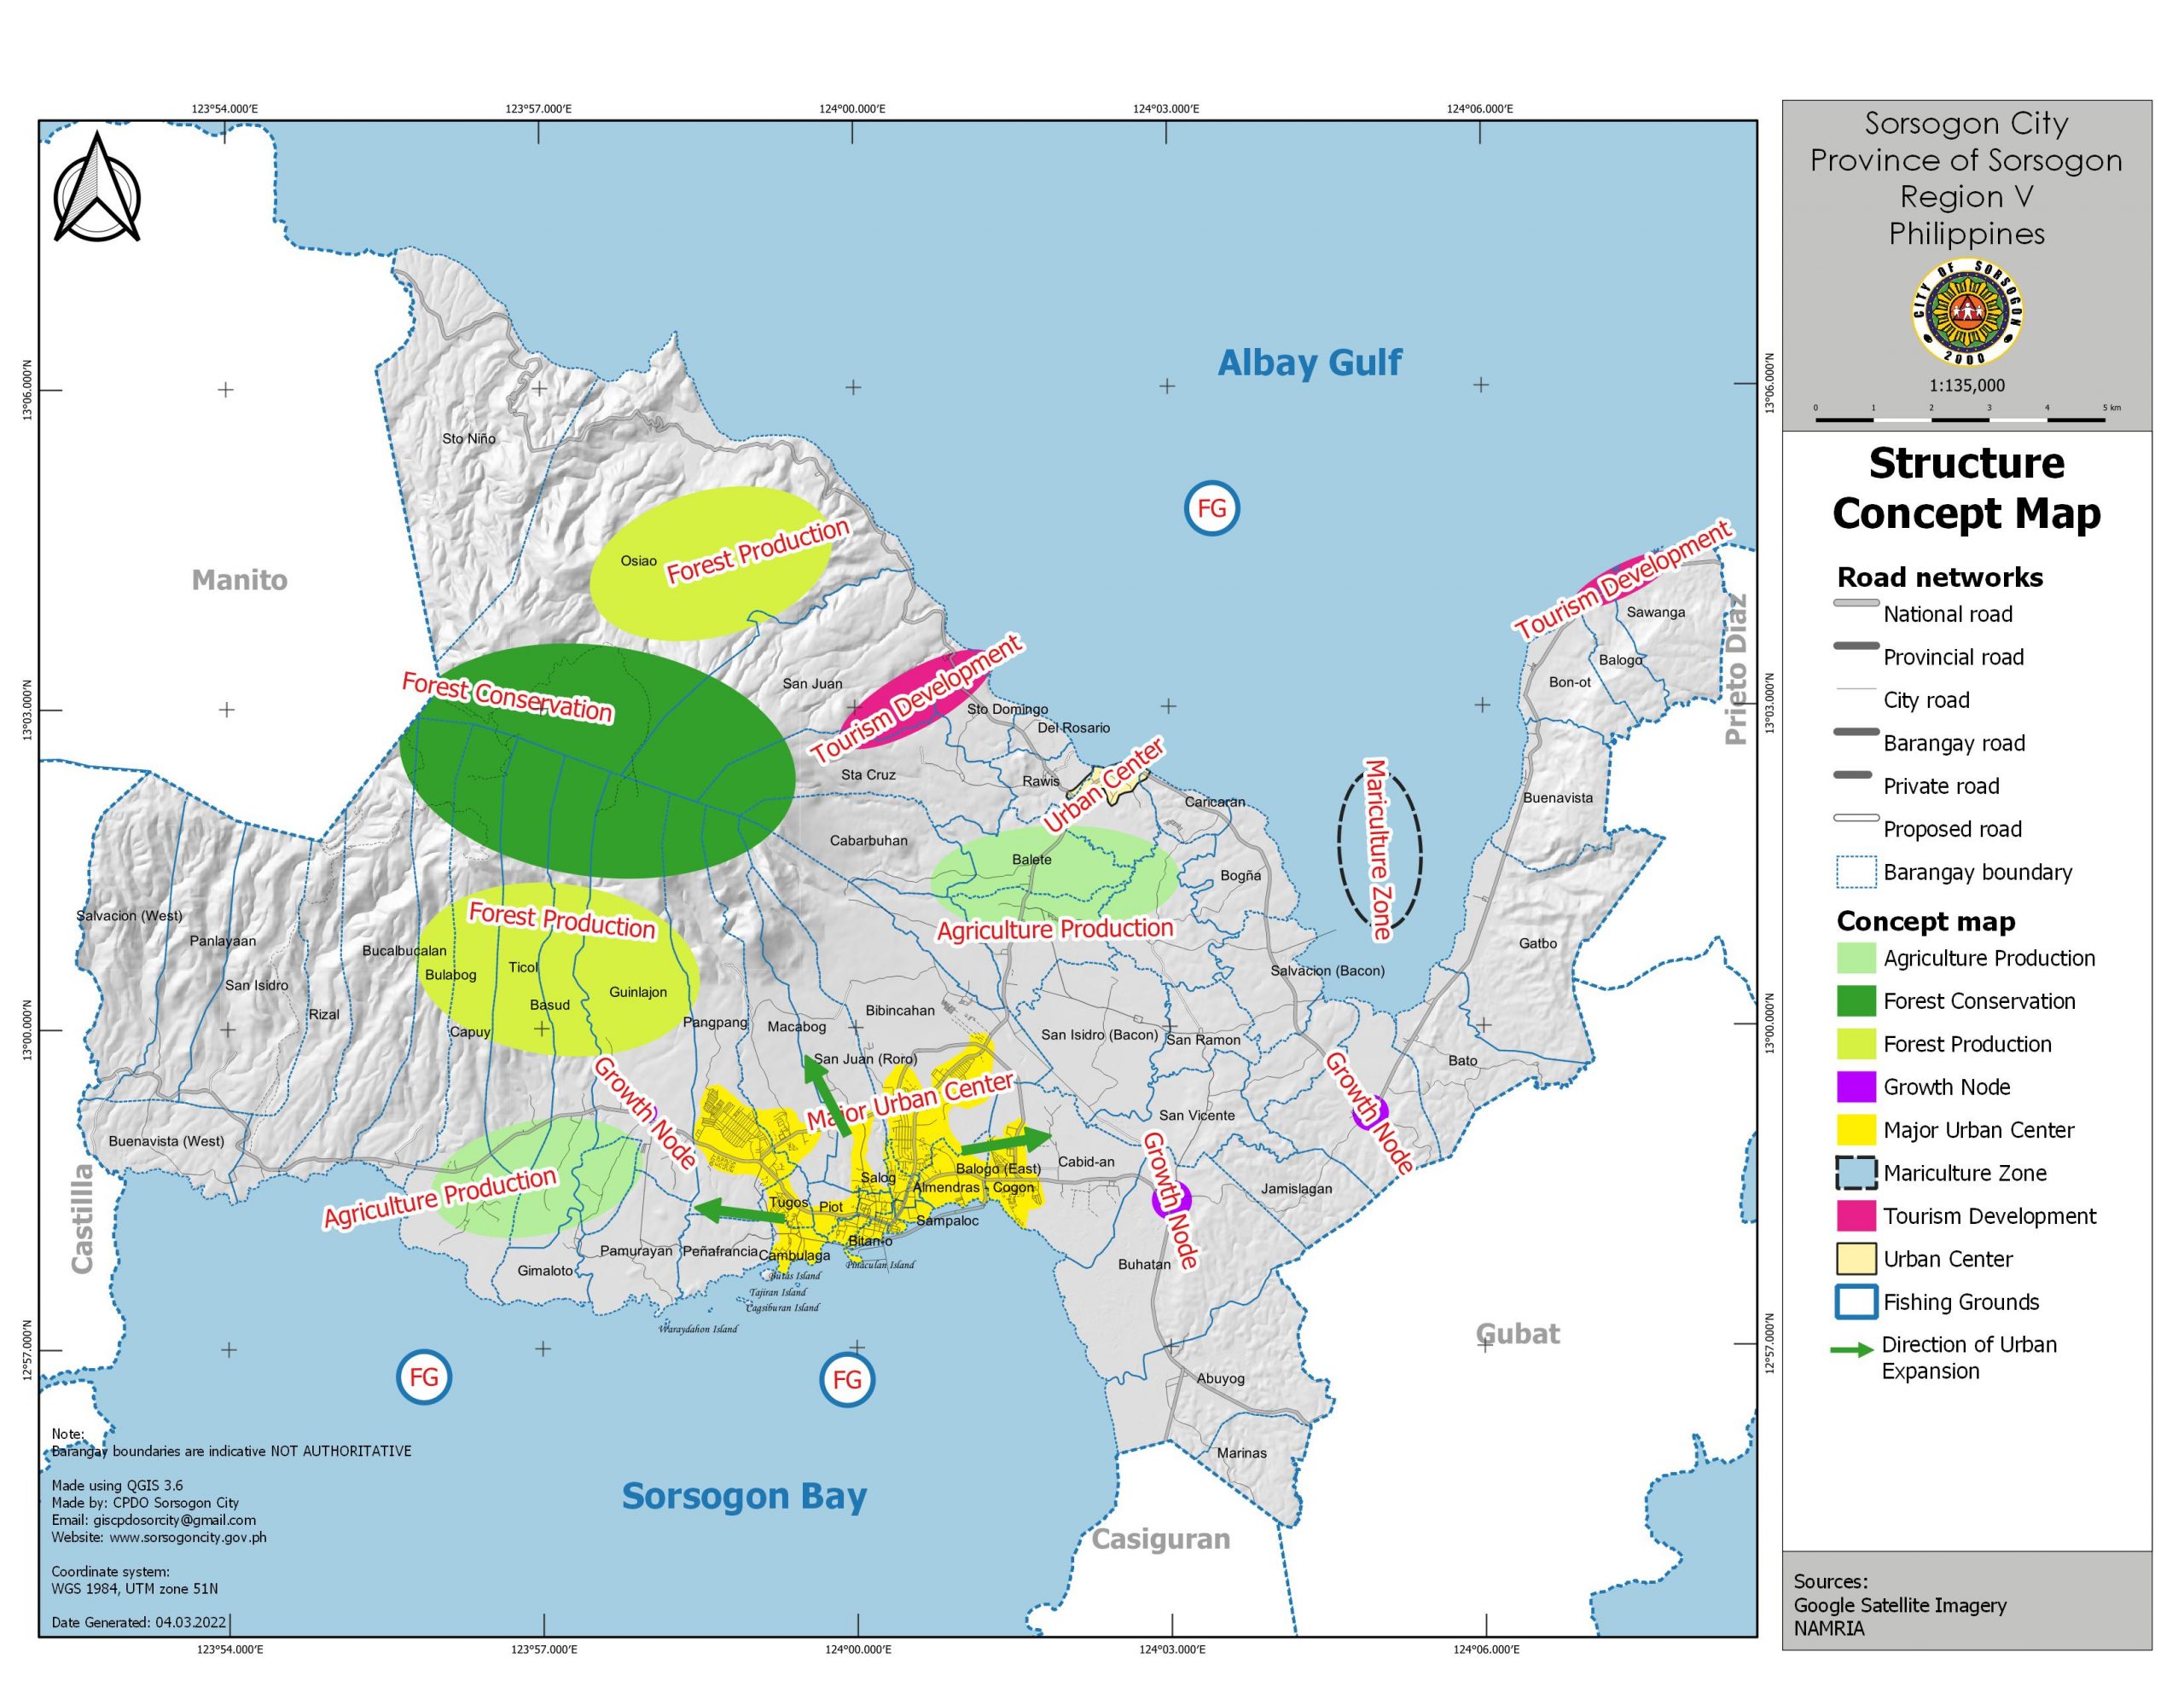
Concepts and notes:
Based on the city’s area and allowable areas for development the following were observed
and findings include:
- Large area for development
- Conflicting uses—sporadic development
- With prime agriculture within developments
- Forest conservation by EDC
- Urban
- Deferred development in some areas
- In filling for compact development
The existing built-up area of the city consists of less than ten percent of the total area. Because
of this, deferred development areas maybe designated for the following reasons:
- Minimize speculation from the landowners of land prices as it has been identified as
development area and discourage unutilized or vacant lands; - Maximize utilizatiion of land as agriciltural land while it has not been classifies as
commercial, residential or non agricultural areas. - Deferred development areas maybe classified as non agricultural areas after five years
or earlier reviewed depending on the pace of urbanization
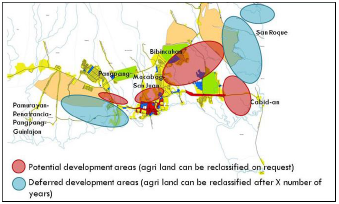
Figure 15. Concept Zone Map
The urban areas of the city will continue to expand through the three linear directions,
going north of the city along Sorsogon-Bacon Road, going west along the Sorsogon-Legazpi
Road, and going West along the Sorsogon Bulan Road. With this urbanization trend, policies
on land and water use particularly on the areas for development will have to be followed and
incorporated to the City Zoning ordinance.
Areas for development
All potential areas for development Considering
With the identified potential areas for development, Identification of potential areas
(agricultural, identified as expansion areas
No rice irrigated zones (rice self-sufficiency), irrigations built by government-if pressure
cannot be avoided – equivalent or more area for conversion
No reclassification of ricelands or prime agricultural areas to higher order
Agricultural lands shall be check
Parks and playground use is the network of parks and playground proposed to be
established. The park system is composed of a city park, district parks, and children’s
playgrounds.
The agri-industrial park proposed to be developed is a 60-hectare in Bibincahan along
the diversion road and inside the delineated economic zone, some
areas in Barangay Balogo, Sampaloc and San Juan-roro in East District and the existing 10
hectares in Cabid-an . The site will accommodate light industrial locators. The site will not be
purely agri-industrial but will also accommodate commercial uses that are needed by the city
in supporting the transshipment corridor role of the province. The site will host a food
terminal, various commercial warehouses, and other transport support businesses. The area
is indicative and suggested addition to existing industrial uses (cement mix), slaughterhouse,
cold storage owned by the city government (non-operational)
This will be subject to a feasibility study covering the viability of the area on several
aspects of the study.
The tourism area is the proposed development of Pinaculan Island into a tourism site,
the Bucalbucalan and Bulabog rest area and tourism market facility, and the low order
commercial development near the EDC site.
Figure 16. Proposed General Land Use Plan
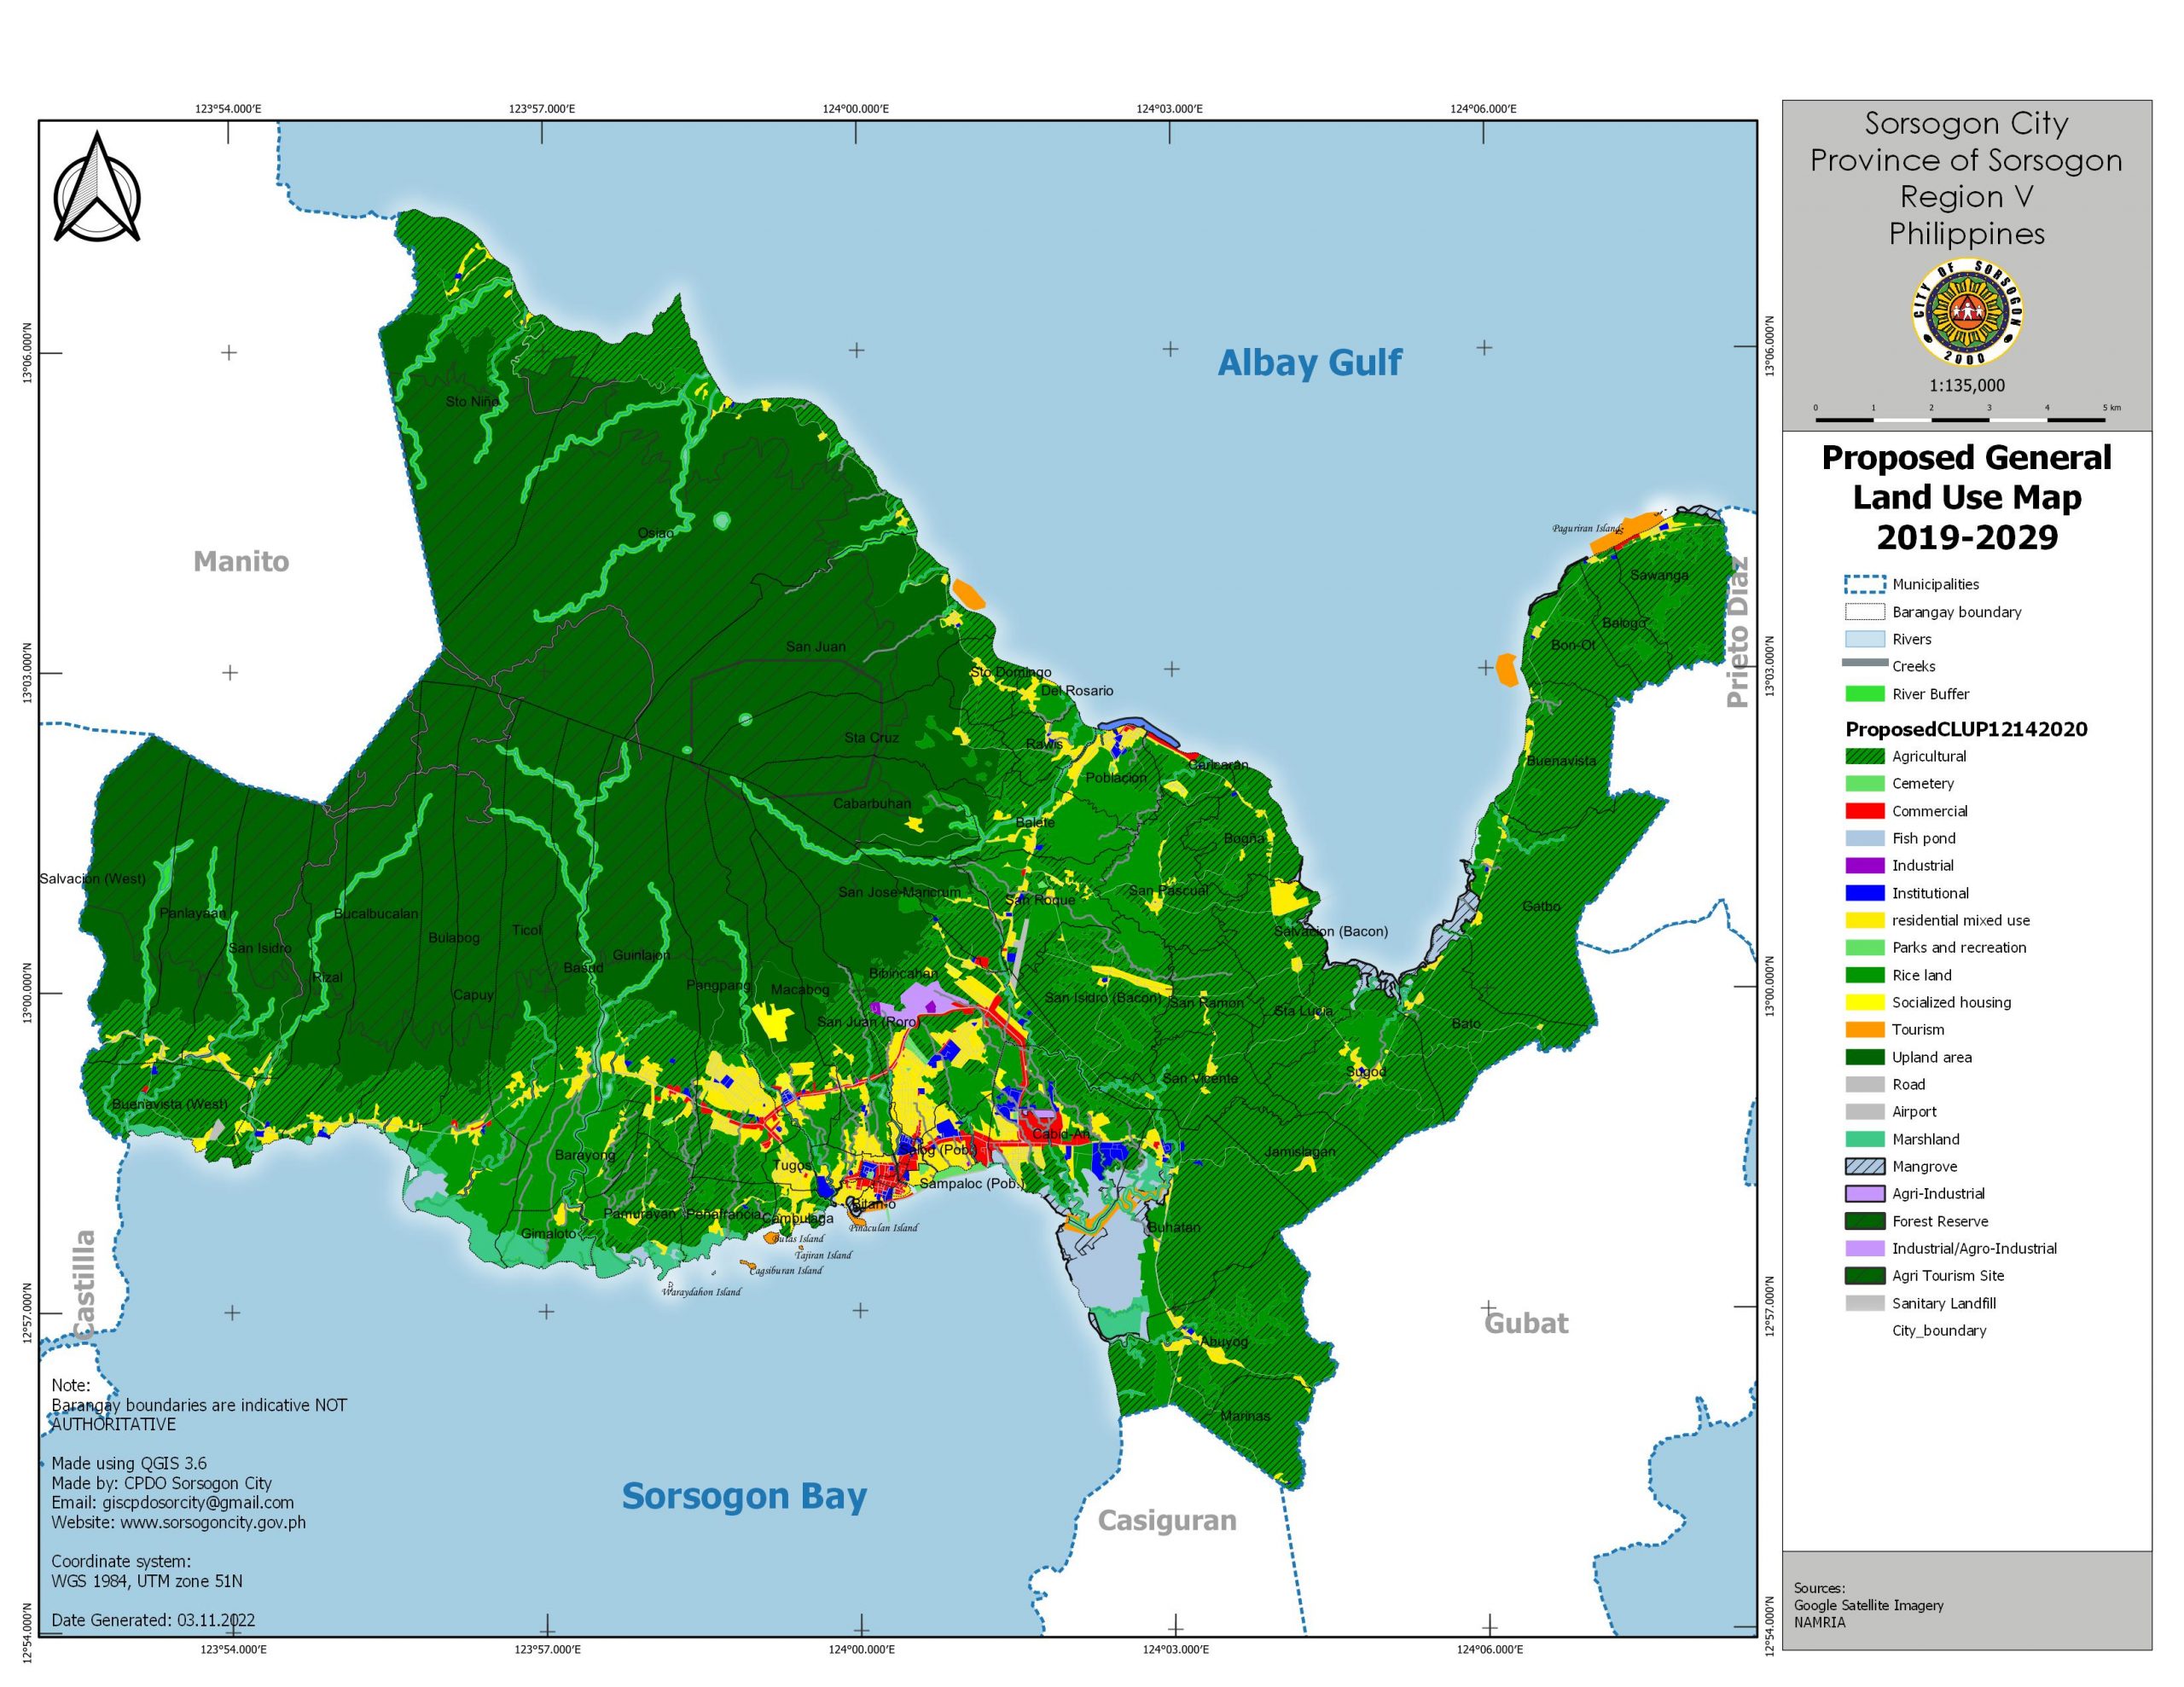
Table 27. Land Classification
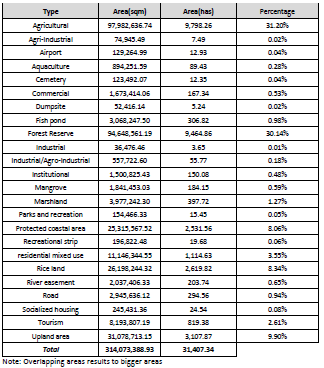
WATER USE
The main bodies of water of the city are Sorsogon Bay (share with other municipalities of
Sorsogon) and Albay Gulf (also shared with other municipalities). Fishery areas and
navigational lanes are the main uses of these big bodies of water. Fixed areas are the
mariculture area in Sugod Bay (part of Albay Gulf) and the green mussel farm in Sorsogon Bay.
Existing fishponds are situated on the marshlands of barangays Abuyog and Buhatan. Once
these are unused, mangrove planting or reforestation is recommended. Fresh water includes
rivers and lakes. Setbacks are mandatory for lots adjacent to it depending on the location as
urban, agricultural, and forest areas.
Figure 17. Water Use Map
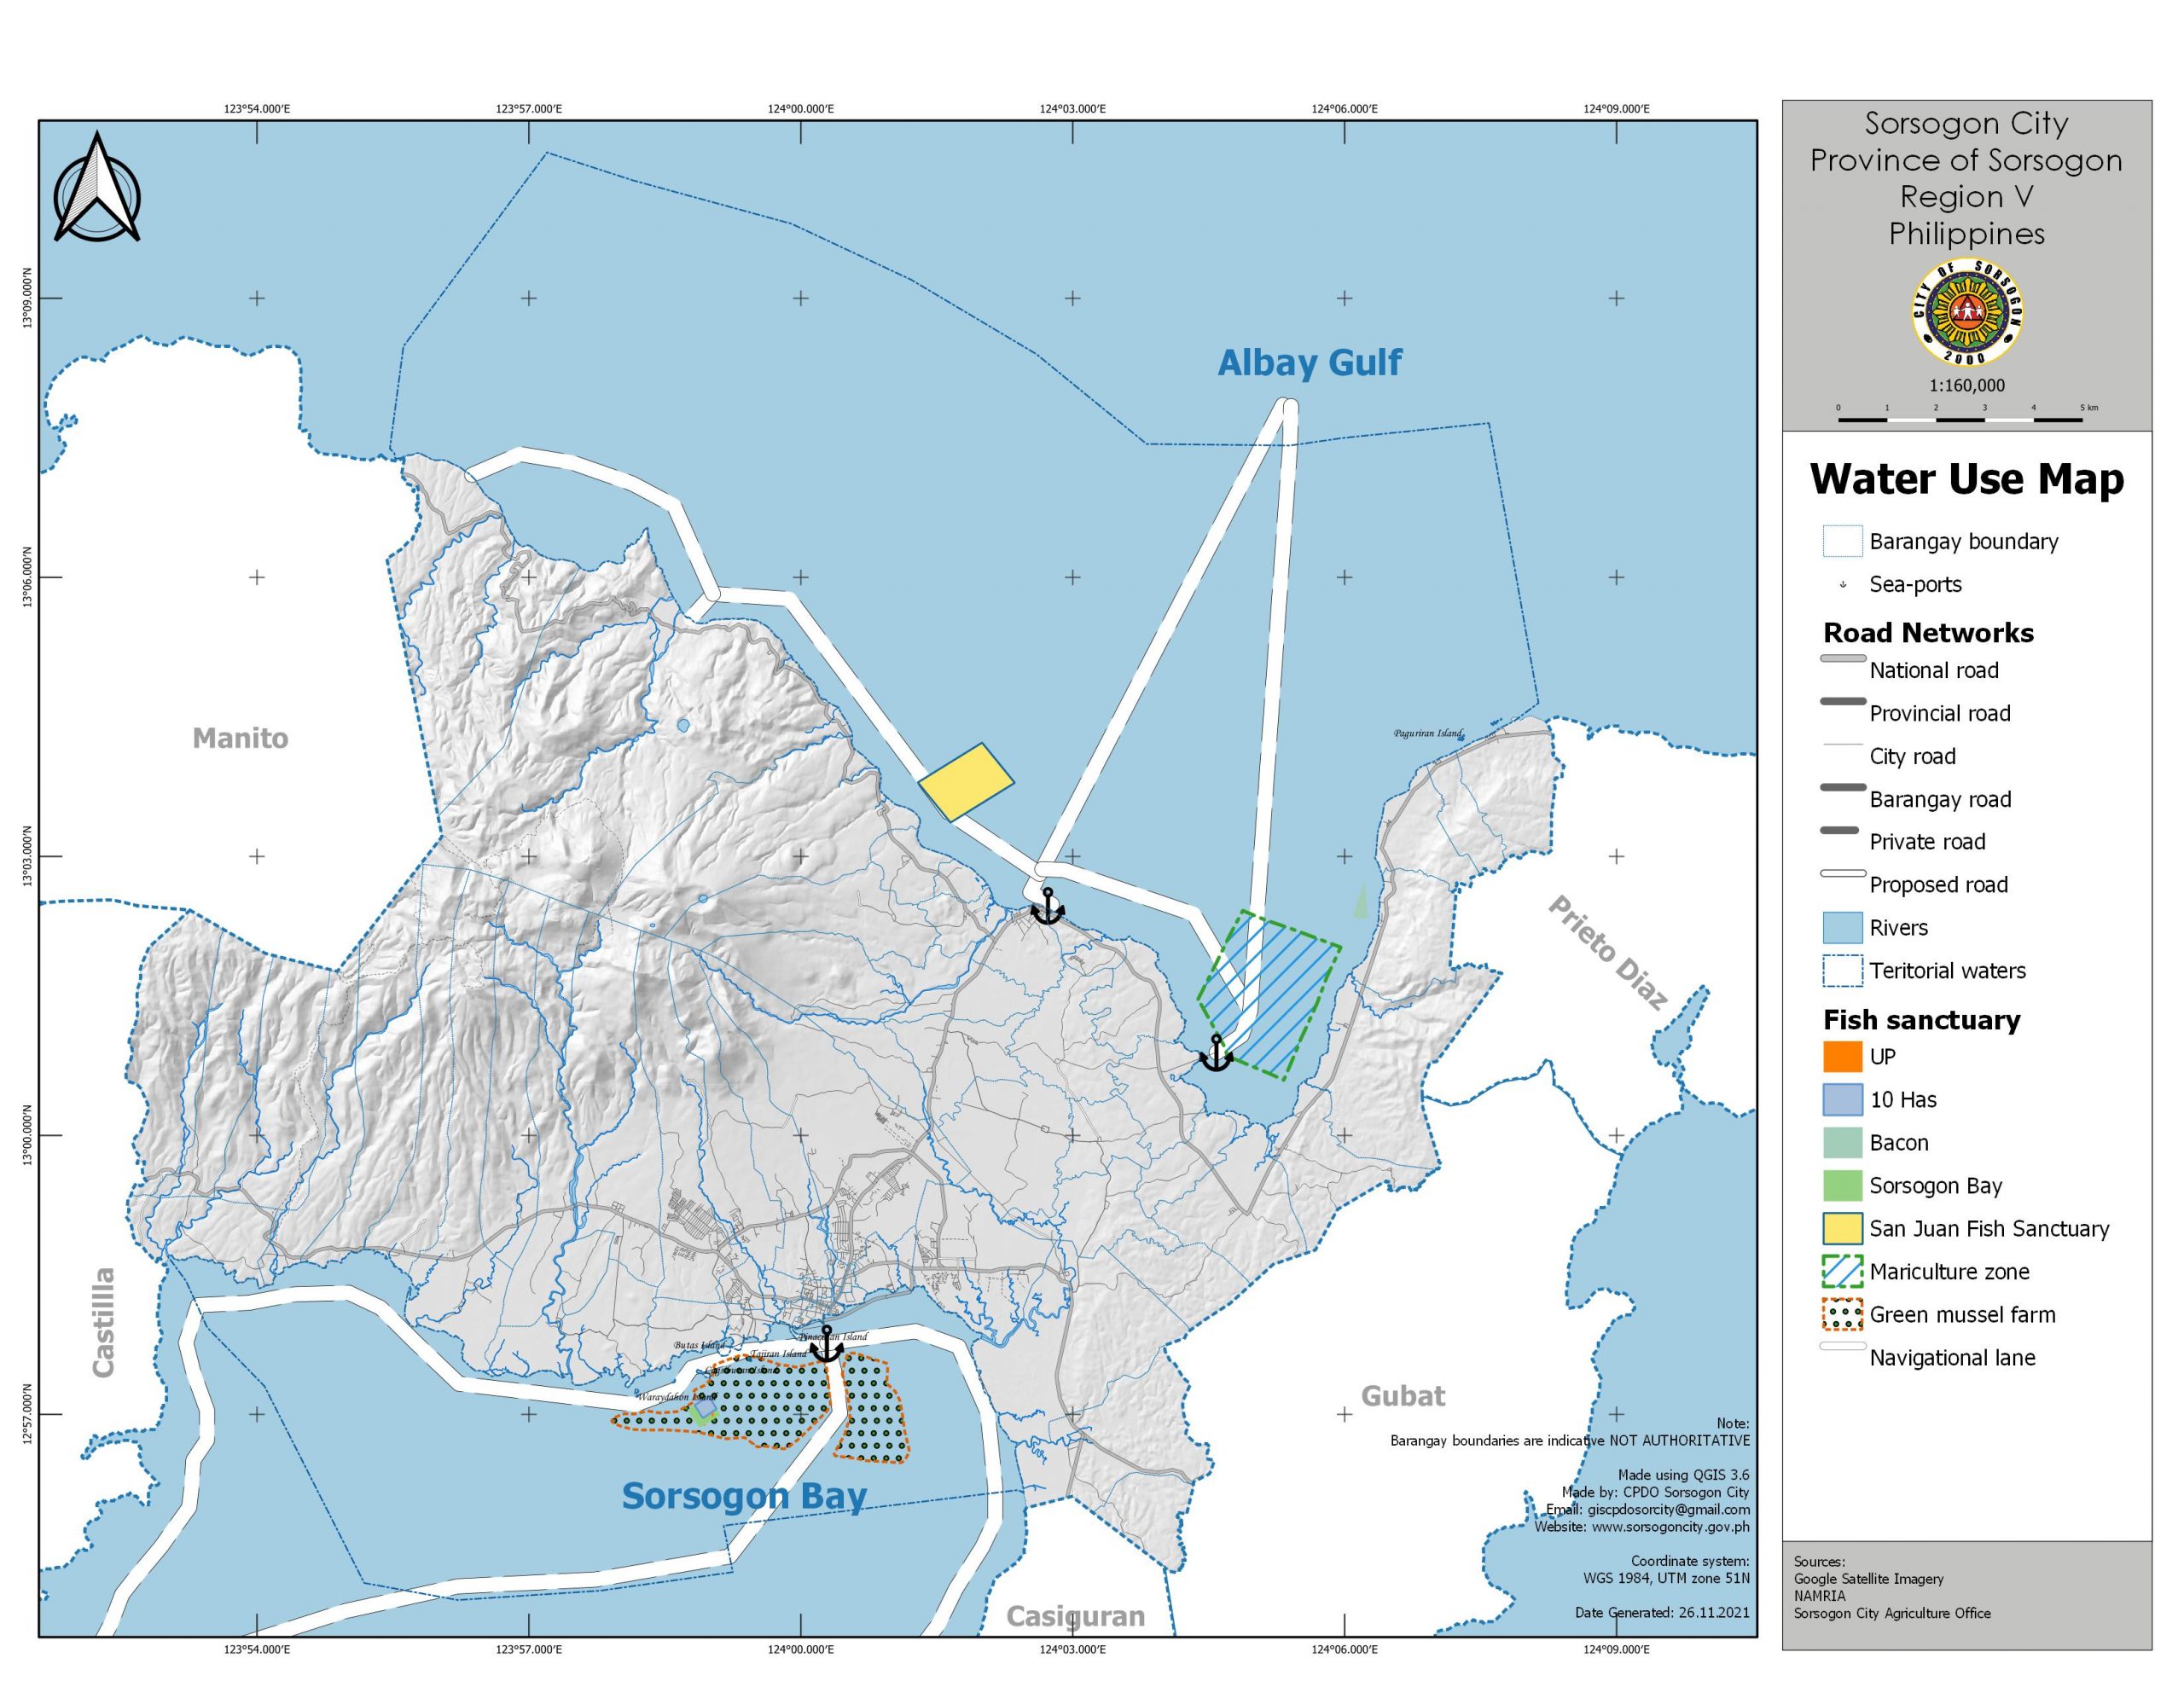
Hazard Overlay Zones
Table 28. Hazard Overlay Zones
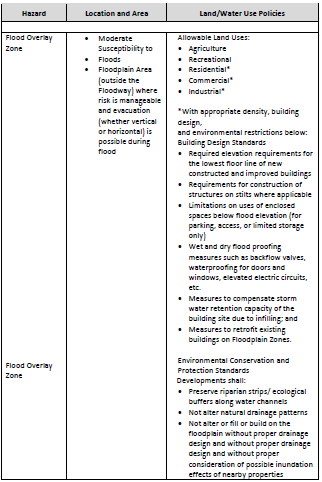
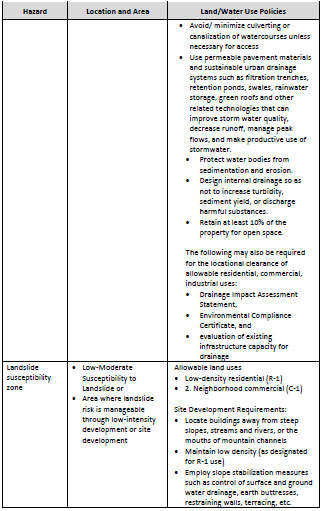
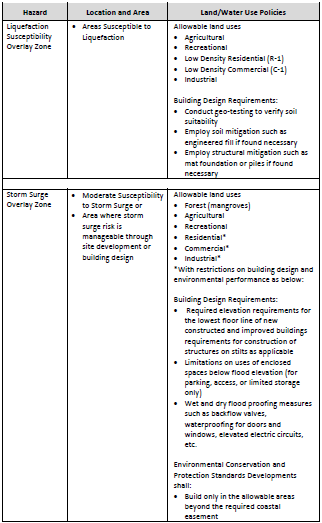
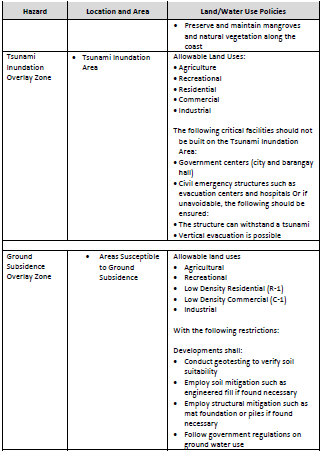
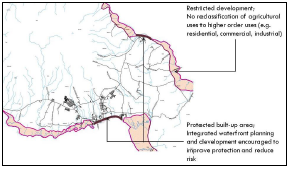
Figure 18 . Land and Water Use Policies
In the same way, the development will adopt the objectives in disaster risk reduction. To
realize this, the following policies will be adhered to:
All existing development shall be protected. These are the built-up areas near the coastlines.
This can be achieved through integrated waterfront planning and development. The main
purpose will be to improve protection and reduce risks.
Areas identified as vulnerable areas shall have restricted development. There shall be no
reclassification of agricultural uses to higher order uses such as residential, commercial or
industrial uses.
Where settlements are not possible for protection, relocation shall be a solution and shall be
planned on a long term.
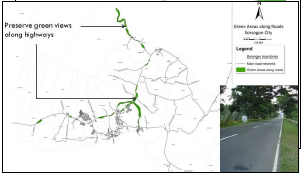
Figure 19. Green Areas AlongThe Road
LAND WATER USE POLICIES
Figure 20. Land Water Use Policies
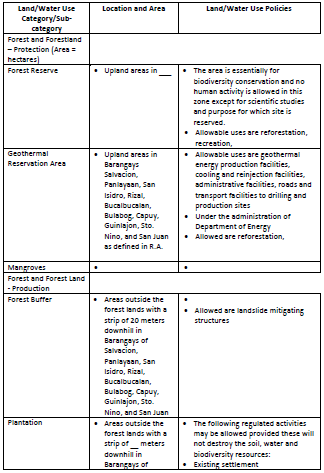
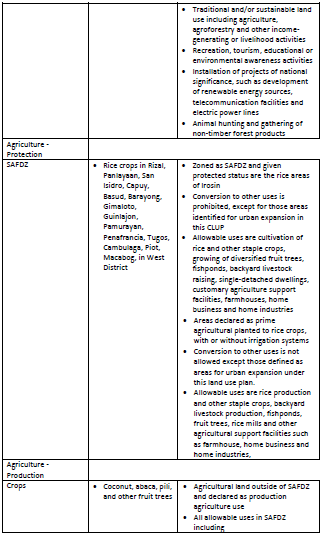
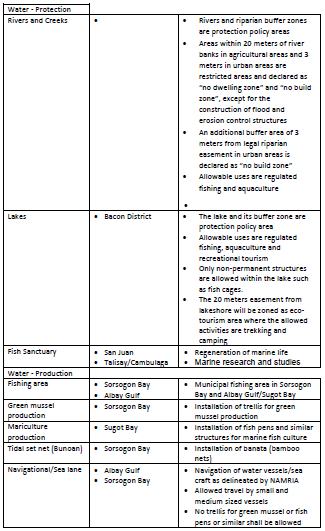
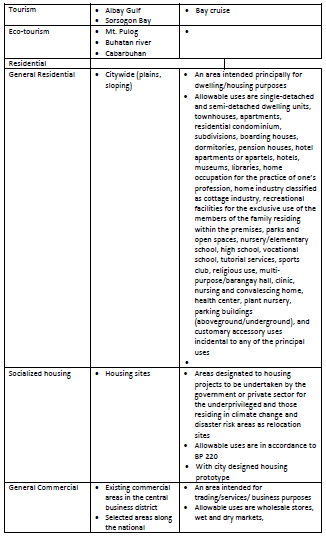
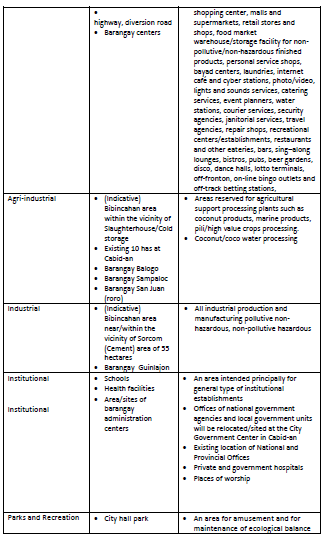
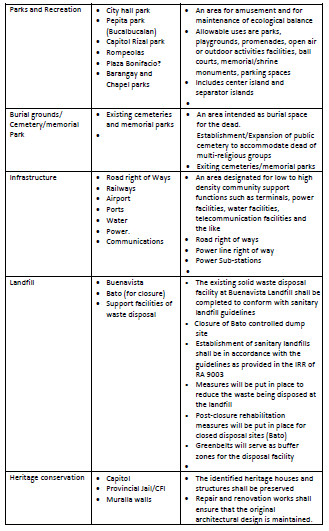
Roads and Bridges/Infrastructure Development Program
Completion of Bacon Manito Road
Construction/completion of Coastal Road
Construction of Pangpang-Tugos-Cambulaga-Talisay Alternate Road
Rehabilitation and Improvement of Buhatan-Jamislagan-Sugod Road
Rehabilitation and Organizational Development of Bacon Water System
Rehabilitation and Improvement of Sorsogon Community Airport
Rehabilitation and Improvement of Drainage Systems
Repair and Improvement of Urban and Rural Roads
Economic Development Program
Development of Light Agro-Industrial Center
Operationalization of Cold Storage Facility
Development of Pili Oil Processing Center
Development of Pinaculan Island Resort
Development of Rompeolas Leisure Park
Improvement of beaches, attractions, and tourism destinations
Development of Water Detention facilities for Irrigation
Establishment of Community Based Tourism program`
Social Development
Relocation of Informal Settlements in Vulnerable Areas
Identification, Acquisition and Development of Barangay Relocation/Expansion Areas
Construction of Water Impounding projects
Construction of School Buildings and Educational Facilities
Improvement of Health Centers
Construction of Balay Bukas Palad
Construction of Secondary Hospital/Dialysis Center
Construction and Improvement of Street Lights
Construction of City Jail
Environment
Construction of Sanitary landfill
Improvement of Materials Recovery facility
Urban Greening program
Parks and Public Open Spaces Development
Development of Wetlands and
Establishment of Water Quality Monitoring System
Establishment of Pollution Control
Establishment of Septage facilities
Mangrove Reforestation
Institutional
Construction of City Hall (new)
Repair and Improvement of Existing City Hall (conversion to other use)
Organizational restructuring
Capacity Development Programs
Legislative Tracking System
Updating of Citizen’s Charter/ISO certification
Repair and Improvement of Barangay Halls
Automation of City Transactions
Information, Education and Communication (IEC) Plan /Advocacy
Proposed Barangay Development Projects
Table 29. Proposed Barangay Development Projects
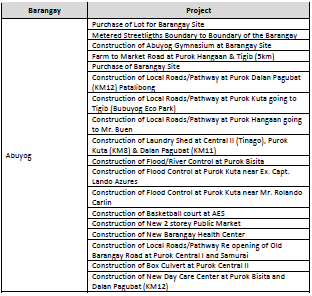
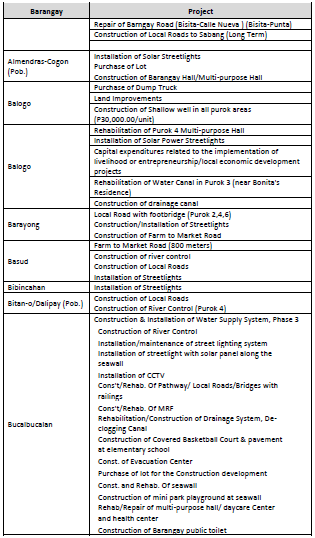
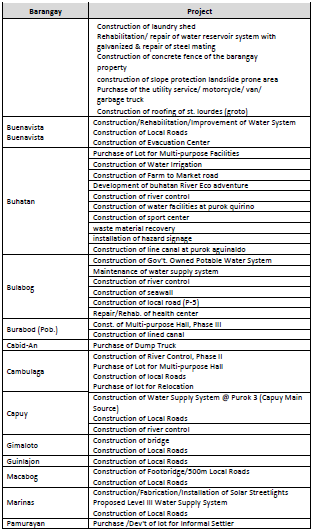
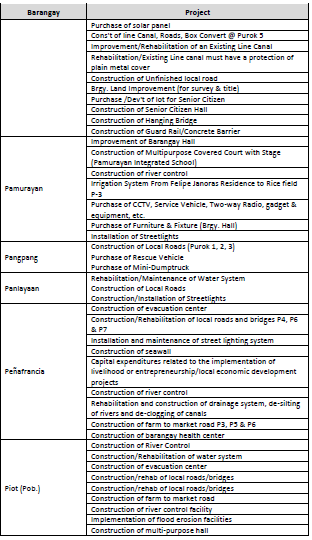
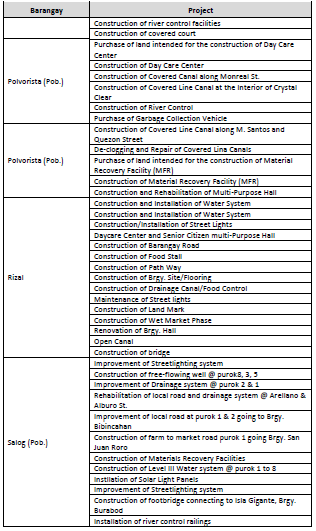
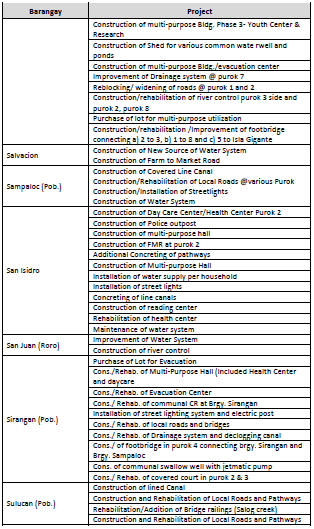
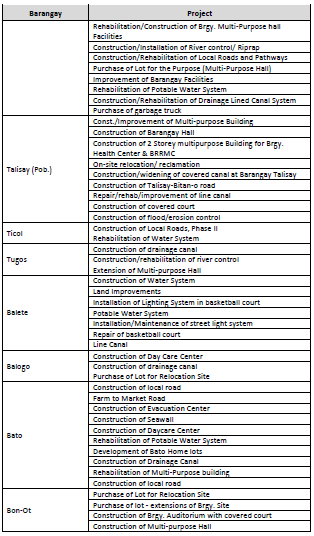
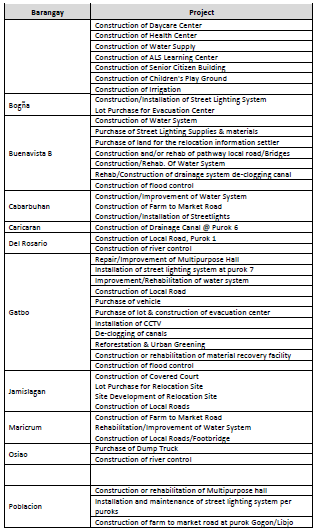
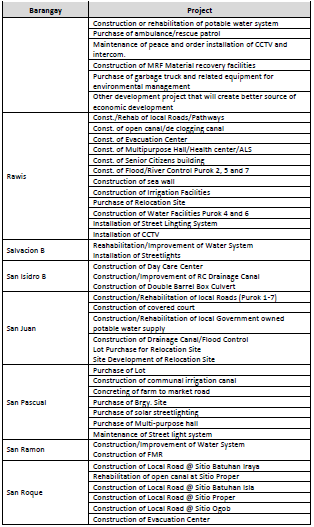
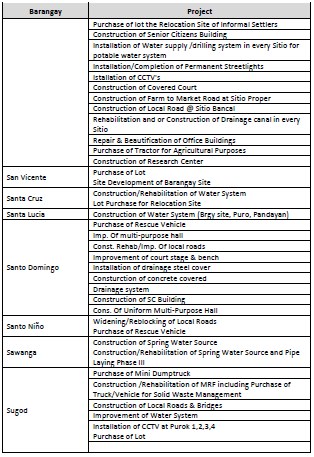
The Comprehensive Land and Water Use Plan of the city will be implemented through the City
Zoning ordinance which forms part of this plan. The city zoning office will be responsible for
the implementation of the ordinance.
Programs and Projects to implement the CLWUP are identified and implemented by the City
Engineering Office for infrastructure and other department and offices depending on their
concern and role.
The plan will have to be reviewed after five years or earlier depending on the pace of
urbanization or growth of the city. Succeeding reclassification and minor changes maybe
made on the amendments of this plan.
The monitoring, review, and evaluation system of this CLUP will assess how fully and
effectively the plan is being carried out and implemented. This will also measure the quality
of life achieved as set forth in the vision. Moreover, an assessment on the CLUP and ZO
implementation reflects its impact in achieving improvements in quality of life of the locality.
The City Development Council shall create a technical monitoring body or working group to
undertake the monitoring, review an evaluation of this plan and zoning ordinance
implementation. Members maybe selected from implementors of this plan. In addition to
CPDO and Zoning administration offices, other members of this group may be selected from
the local and national offices with concerns on forestry, coastal and marine waters, culture
and heritage, and climate and disaster risk management.
The working group shall develop a system for easy monitoring and communicating the status
of implementation of the plans and zoning ordinance. The development of an MRE systems
and procedures shall ensure that changes in land uses and progress in priority programs and
projects implementation are traced. The system shall include indicators on:
- Biodiversity
- Water production value
- Economic production value
- Nature based tourism value
- Protection to lives and properties
- Protection to infrastructures
An annual analysis and report shall be conducted by the working group and reported to the
City Development Council and the office concerned. Recommendations may include Identified
areas for co-management, convergence or inter-LGU/inter-governmental partnership
arrangements. Below is a sample of the output and outcome indicators:
Proposed CLUP Outcome and Output Indicators
Table 30. Proposed CLUP Outcome and Output Indicators
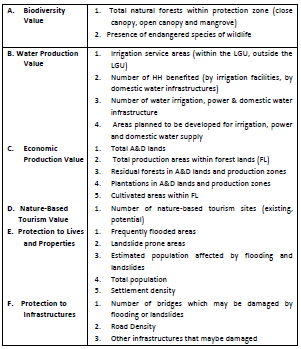
Other indicator systems such as that of population and development may be
The functions of the secretariat for monitoring, review and evaluation review shall include:
- Coordination with all relevant local and national agencies, including research/
academic, private sector, NGOs/CSOs groups, to generate and consolidate
necessary information for MRE. - Preparation of the CLUP Progress Report Card in cooperation with other relevant
local and national agencies and institutions. - Submission of monitoring reports to the SB, LDC and LCE on an annual basis.
Since the Zoning Administration Office, as an implementor of the zoning ordinance is a
separate department from the City Planning and Development Office, it shall coordinate
closely with the latter in terms of MRE.
While monitoring report is done yearly, the CLUP and ZO review shall be conducted every four
years or as the need arises. It will be noted that certain development areas are deferred for
development to avoid speculations and maximize the use of land. It is up for the committee
recommend the action on these areas.